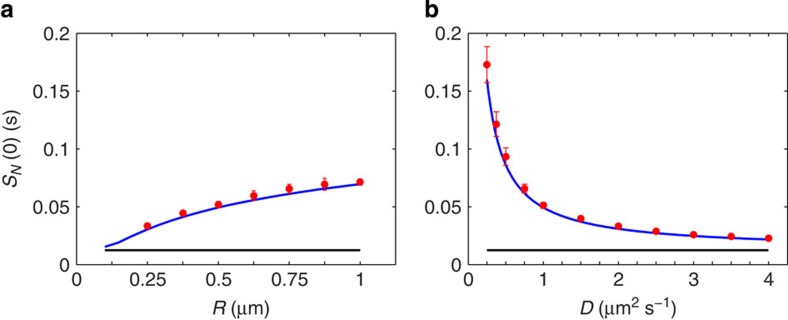
Figure 2. Simulations of a ring of 15 receptors in 2D.
Predicted value of SN(0)=2τN〈δN2〉 (blue lines) is plotted against simulations (red circles), demonstrating the effect of domain size (a) and the diffusion coefficient (b). The component of the prediction due to reaction noise alone is plotted as a baseline (black lines). Error bars are s.d. from n=10 simulations. Parameters:  ,
,  , k+=2 μm2 s−1, k−=300 s−1, a=10 nm, b=0.07 μm and D=1 μm−2 s−1 (a), R=0.5 μm (b).

