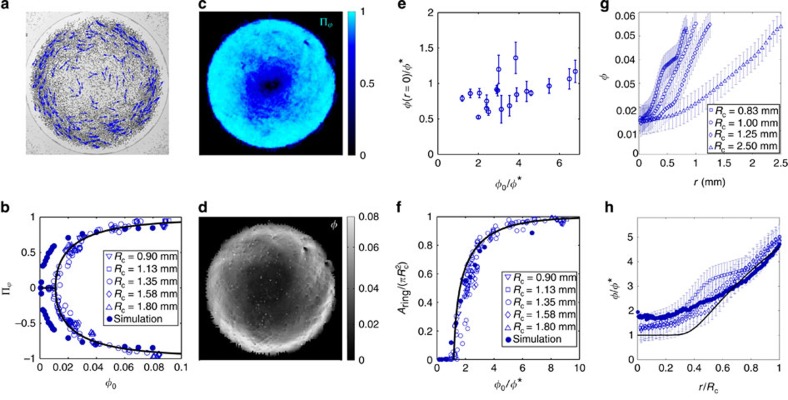
Figure 3. Collective-dynamics experiments.
(a) Snapshot of a vortex of rollers. The dark dots show the position of one half of the ensemble of rollers. The blue vectors represent their instantaneous speed (Rc=1.35 mm, φ0=5 × 10⁻²). (b) Average polarization plotted versus the average packing fraction for different confinement radii. Open symbols: experiments. Full line: best fit from the theory. Filled circles: numerical simulations (b=3a, Rc=1 mm). (c) Time-averaged polarization field (Rc=1.35 mm, φ0=5 × 10⁻²). (d) Time average of the local packing fraction (Rc=1.35 mm, φ0=5 × 10⁻²). (e) Time-averaged packing fraction at the centre of the disc, normalized by  and plotted versus the average packing fraction. Error bars: one standard deviation. (f) Fraction of the disc where
  versus the average packing fraction. Open symbols: experiments. Full line: theoretical prediction with no free fitting parameter. Filled circles: numerical simulations (b=3a, Rc=1 mm). (g) Radial density profiles plotted as a function of the distance to the disc centre r. All the experiments correspond to φ0=0.032±0.002, error bars: 1σ. (h) Open symbols: same data as in g. The radial density profiles are rescaled by
  and plotted versus the rescaled distance to the centre r/Rc. All the profiles are seen to collapse on a single master curve. Filled symbols: Numerical simulations. Solid line: theoretical prediction. All the data correspond to E0/EQ=1.1.

