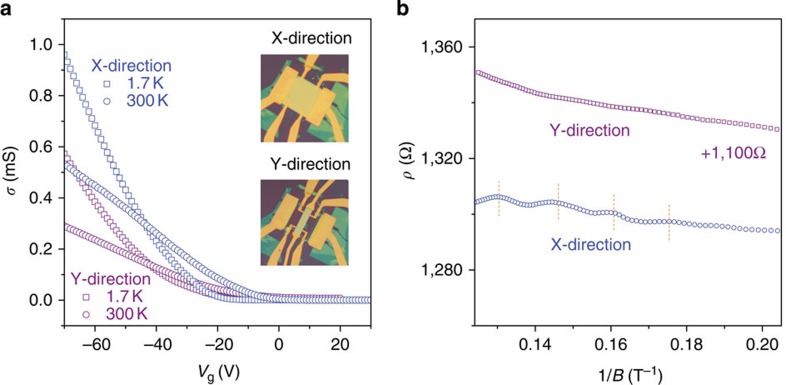
Figure 4. SdH oscillations in the BN–BP–BN heterostructure samples along the X- and Y- directions.
(a) The conductivity of Sample C along the X- and Y- directions at 1.7 K and 300 K. The insets are optical images of Sample C before and after reshaping. (b) SdH oscillations measured at Vg=−60 V from the samples along the X- and Y- directions.

