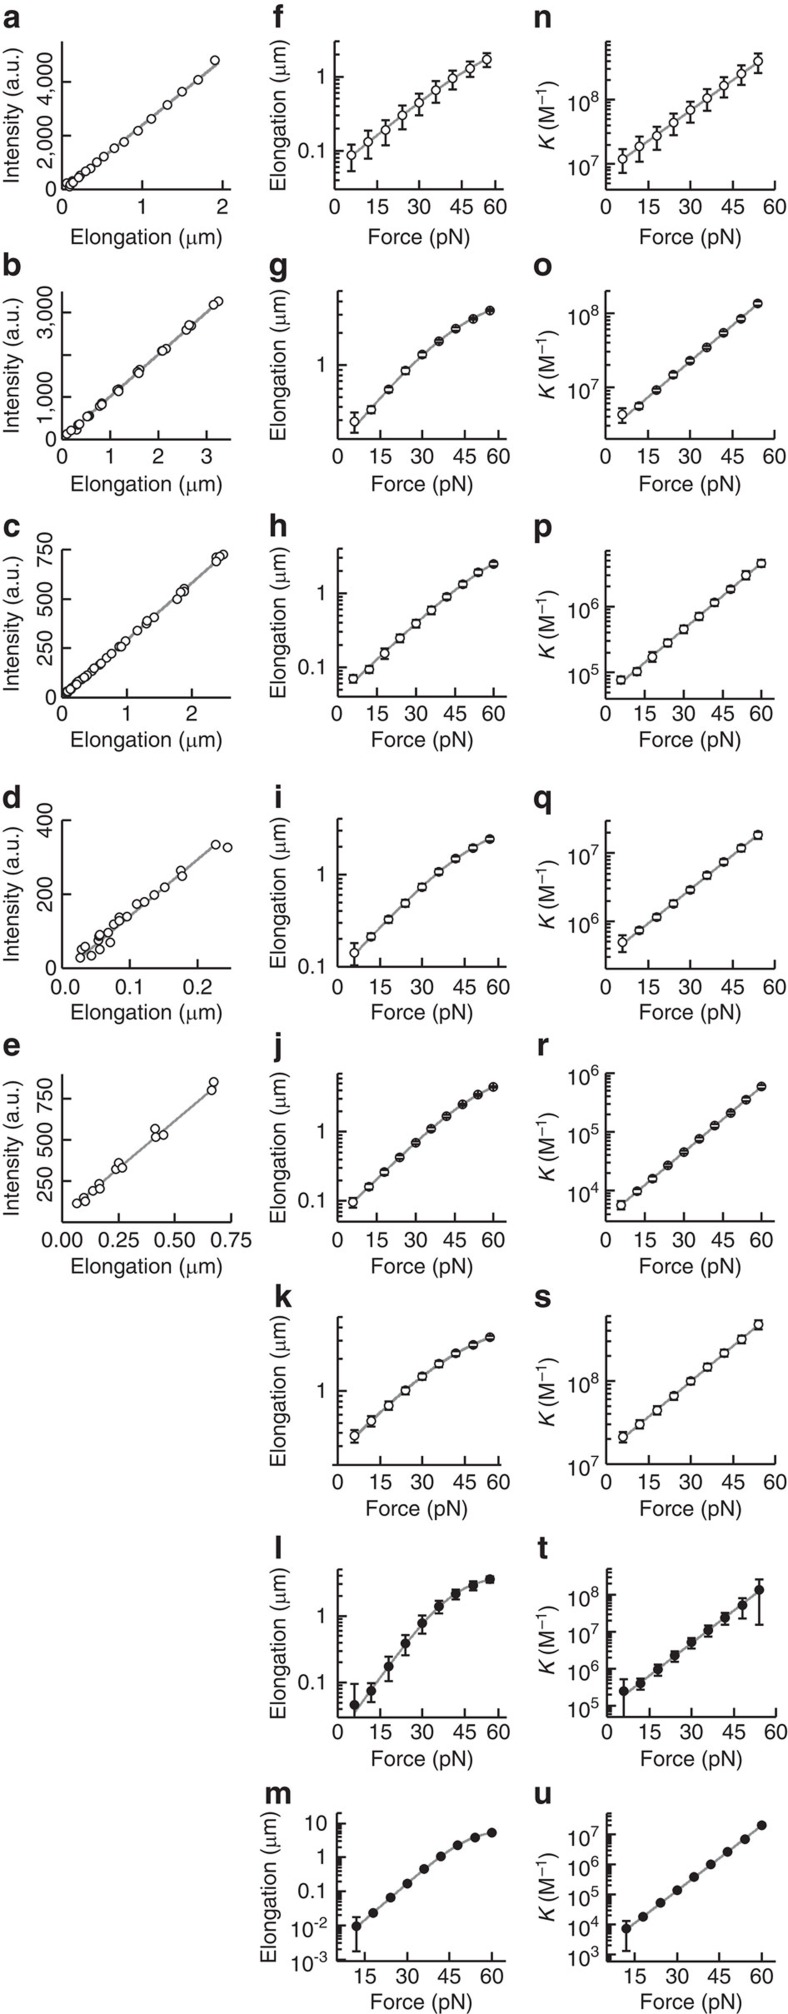
Figure 3. Force-dependent equilibrium binding data of mono- (open symbols) and bis-intercalators (closed symbols).
In all cases, the fluorescence increase scales linearly with elongation (a–e), the elongation versus force can be well fitted with the multiligand binding model (f–m) and the resulting affinity constant K scales single-exponentially with force (n–u). Grey curves are linear fits (a–e), fits of equation (5) (Methods, f–m) and fits of equation (2) (n–u). (a,f,n) Overall, 0.5 nM SbG with 100 mM NaCl; (b,g,o) 5 nM SxO with 100 mM NaCl; (c,h,p) 20 nM SxO with 1,000 mM NaCl; (d,i,q) 20 nM YO with 100 mM NaCl; (e,j,r) 1.0 μM YO with 1,000 mM NaCl; (k,s) 1.5 nM SxG with 100 mM NaCl; (l,t) 7 nM POPO with 100 mM NaCl; (m,u) 40 nM POPO with 1,000 mM NaCl. For SxG and POPO, the scaling of elongation with fluorescence could not be reliably performed because of the low signal-to-noise ratios and the high photobleaching rates. Error bars, s.e.m., n≥5.

