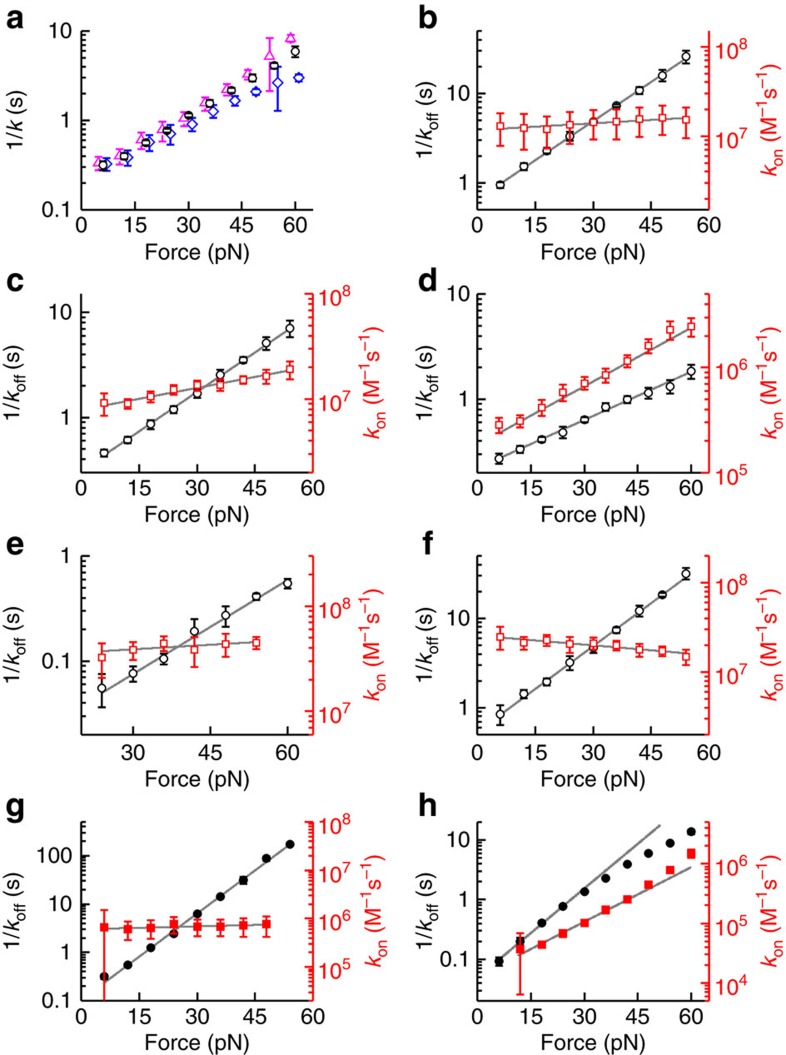
Figure 5. Kinetics of dye-binding for mono- (open symbols) and bis-intercalators (closed symbols).
(a) Comparison of measured koff values (black circles) with the corresponding equilibration rate keq (blue diamonds) for 10 nM SbG at 1,000 mM NaCl reveals that the difference between keq and koff scales with the dye coverage (cf.
equation (6), Methods) such that significant deviations are only observed at high tension. A direct calculation of koff based on the measured  and keq and equation (6) (blue diamonds) shows that the measured and calculated koff are in good agreement. (b–h) Measured (inverse) off- (black circles) and on-rates (red squares). SbG with 100 mM NaCl (b); SxO with 100 mM NaCl (c) and 1,000 mM NaCl (d); YO (e) and SxG (f) with 100 mM NaCl; POPO with 100 mM NaCl (g) and 1,000 mM NaCl (h). Grey curves show exponential fits of the data. The fits in h are restricted to the force range 0<F≤24 pN because koff(F) exhibited a nonexponential force dependence at higher forces. Error bars, s.e.m., n≥5.

