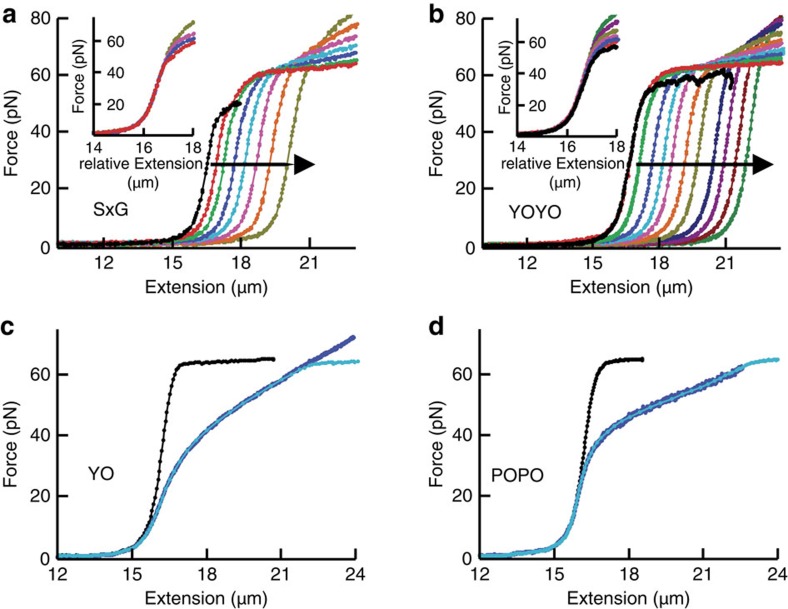
Figure 6. Impact of intercalators on DNA mechanics.
(a,b) Nonequilibrium force-extension curves of SxG (a) and YOYO (b) at 10 and 25 mM NaCl, respectively, at increasing dye coverage (direction of increase indicated by arrows). For each curve, the dye coverage is essentially constant (Methods). Insets, curves shifted horizontally to overlay low-force regions. (c,d) Equilibrium force-extension curves in absence (black) and presence (blue) of YO (c) and POPO (d) at 1,000 mM NaCl. Cyan, fits to data compiled from the black curve using equation (4).

