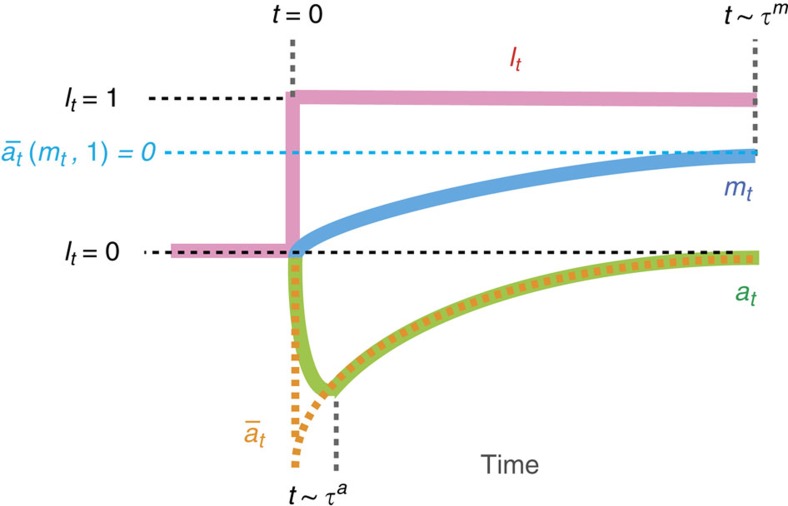
Figure 2. Typical dynamics of adaptation with the ensemble average.
Suppose that lt changes as a step function (red solid line). Then, at suddenly responds (green solid line), followed by the gradual response of mt (blue solid line). The adaptation is achieved by the relaxation of at to  (orange dashed line). The methylation level mt gradually changes to
  (blue dashed line).

