
Figure 4. Numerical results of the information-thermodynamics bound on the robustness.

We compare the robustness  (red line), the information-thermodynamic bound
  (green line) and the conventional thermodynamic bound
  (blue line). The initial condition is the stationary state with
 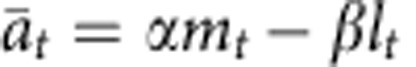 , fixed ligand signal βlt = 0, and noise intensity Ta = 0.005. We numerically confirmed that
 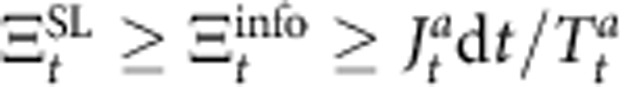 holds for the six transition processes. These results imply that, for the signal transduction model, the information-thermodynamic bound is tighter than the conventional thermodynamic bound. The parameters are chosen as τa = 0.02, τm = 0.2, α = 2.7 and
  to be consistent with the real parameters of E. coli bacterial chemotaxis 7,14,16. We discuss the six different types of input signals βlt (red solid line) and noises
  (green dashed line). (a) Step function: βlt = 0.01 and
  for t > 0. (b) Sinusoidal function: βlt = 0.01 sin(400t) and
  for t > 0. (c) Linear function: βlt = 10t and
  for t > 0. (d) Exponential decay: βLt = 0.01[1−exp(−200t)] and
  for t > 0. (e) Square wave:
  and
and  for t > 0, where
  denotes the floor function. (f) Triangle wave:
  and
and  for t > 0.