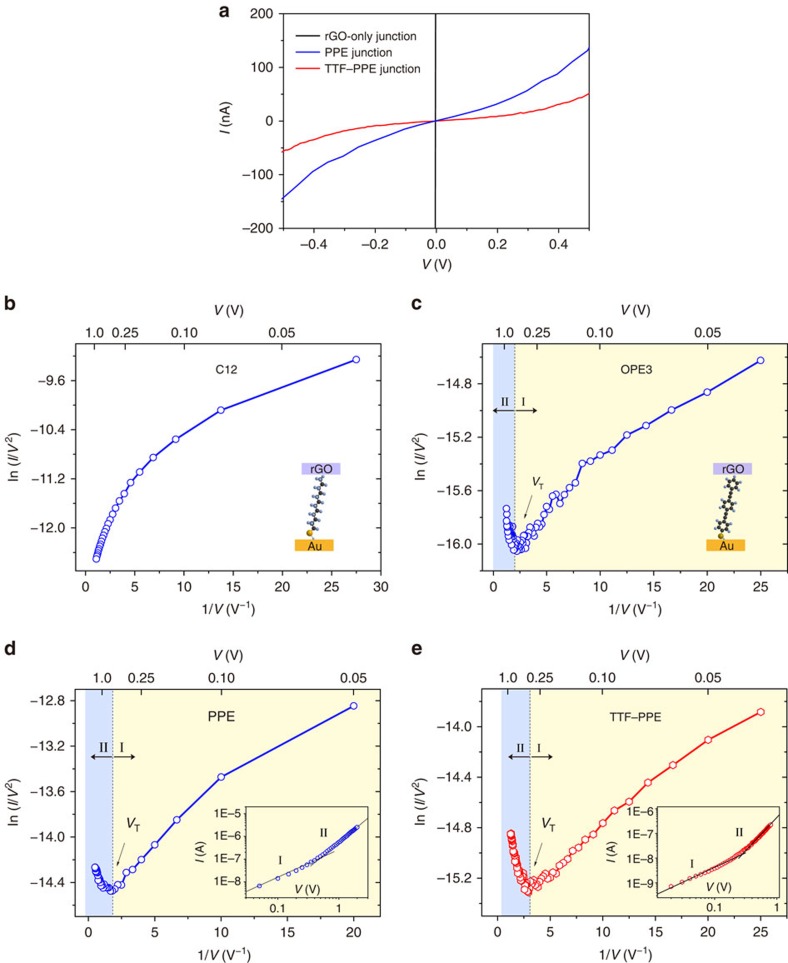
Figure 3. I–V characteristics of molecular tunnelling junctions.
(a) Representative I–V curves of rGO-only junctions and junctions based on PPE and TTF–PPE ultrathin films. (b–e) Fowler–Nordheim plots for I–V traces of junctions based on (b) C12, (c) OPE3, (d) PPE and (e) TTF–PPE. Two distinct regimes (I and II) are clearly observable in c, d and e with a minimum at Vtrans. Insets of d and e show log–log plot of representative I–V traces for PPE and TTF–PPE junctions.

