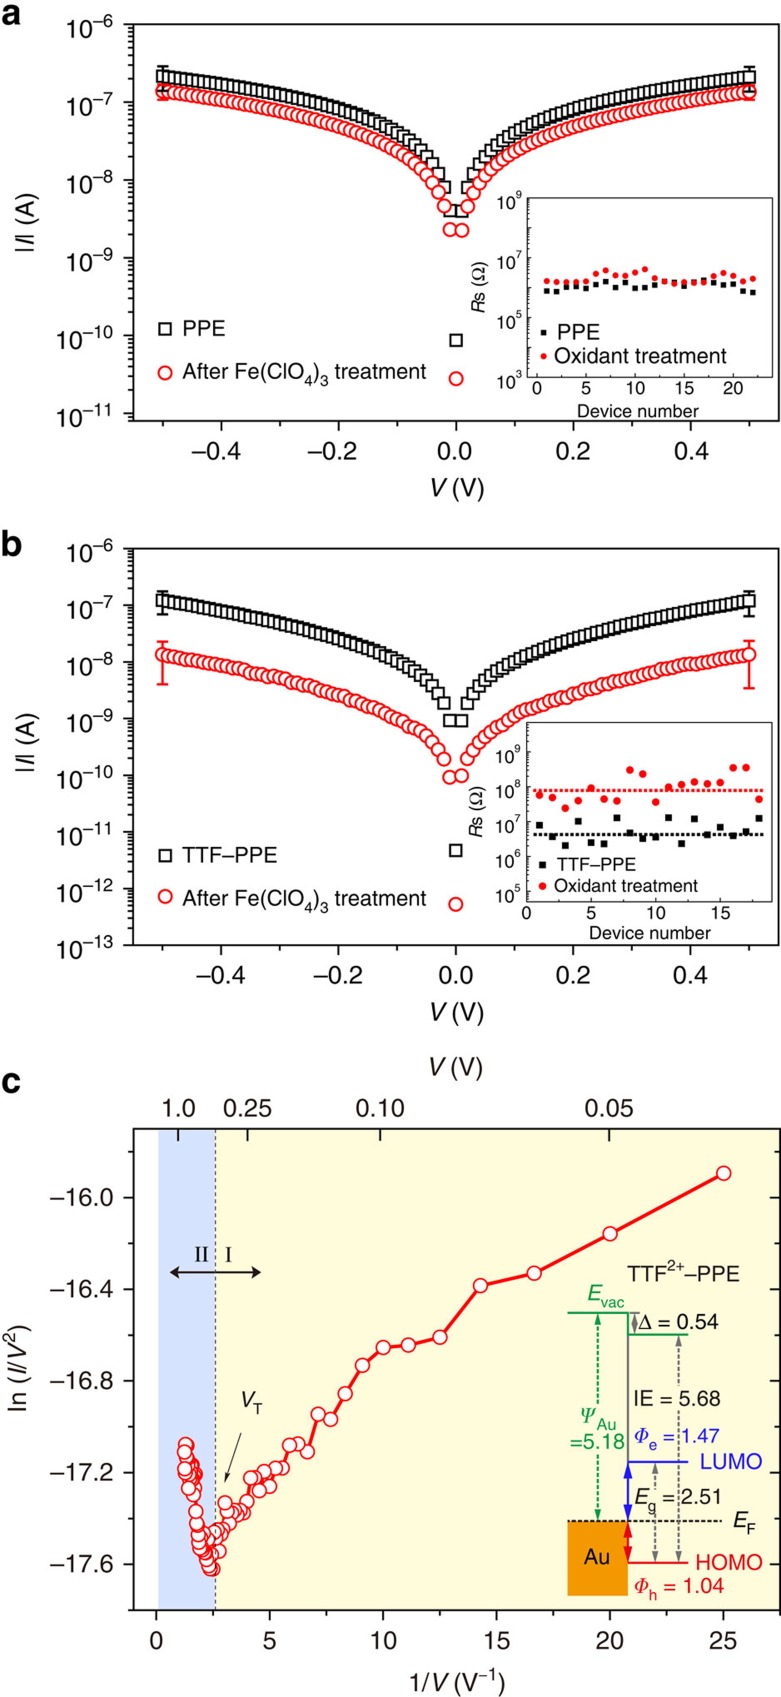
Figure 5. Modulation of TTF–PPE junctions via chemical oxidation.
I–V characteristics of (a) PPE and (b) TTF–PPE junctions before/as-prepared (black square) and after treated with excess iron perchlorate hexahydrate (red circle). The plots are generated from average values obtained from least 20 junctions of the same batch. Insets of a and b show statistics on sheet resistance of the PPE and TTF–PPE junctions, respectively. (c) Fowler–Nordheim plot for I–V traces of TTF2+–PPE junctions. Inset shows the energy level diagram of TTF2+–PPE/Au.

