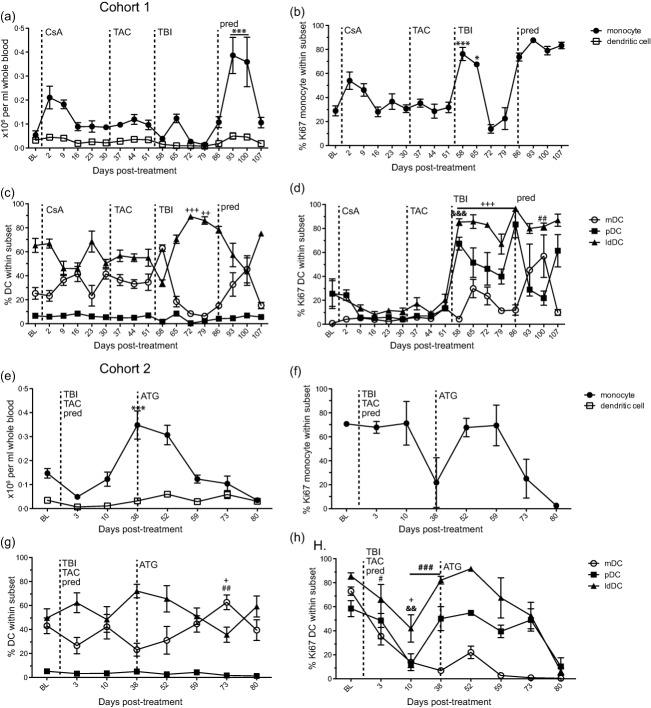
Fig. 6.
Effect of immunosuppression on monocyte and dendritic cell (DC) populations. Absolute number of monocytes (closed square) and DC (open square) were counted per ml of whole blood at various days post-infection in (a) cohort 1 and (e) cohort 2. Frequency of DC subsets: myeloid (mDC), plasmacytoid (pDC) and less-differentiated (ldDC) DCs in peripheral blood mononuclear cells (PBMC) measured by flow cytometry in (c) cohort 1 and (g) cohort 2. Percentage of proliferating monocytes in (b) cohort 1 and (f) cohort 2 and DC subsets in (d) cohort 1 and (f) cohort 2 from PBMC measured by flow cytometry based on the expression of Ki67. Average ± standard error of the mean (s.e.m.). Dashed line indicates onset or change in immunosuppressive treatment; total body irradiation (TBI), cyclosporin A (CsA), tacrolimus (TAC), prednisone (pred), anti-thymocyte globulin (ATG), anti-CD3 immunotoxin (CD3-IT), and Janus activated kinase inhibitor (JAK-Inh). Statistical analysis was performed using one-way repeated-measures analysis of variance (anova) with Tukey's post-test to test differences between pre- and post-treatment values P < 0·001 ***monocyte, ###mDC, &&&pDC, +++ldDC; P < 0·01 &&pDC, ##mDC, ++ldDC; P < 0·05 *monocyte, #mDC, +ldDC.

