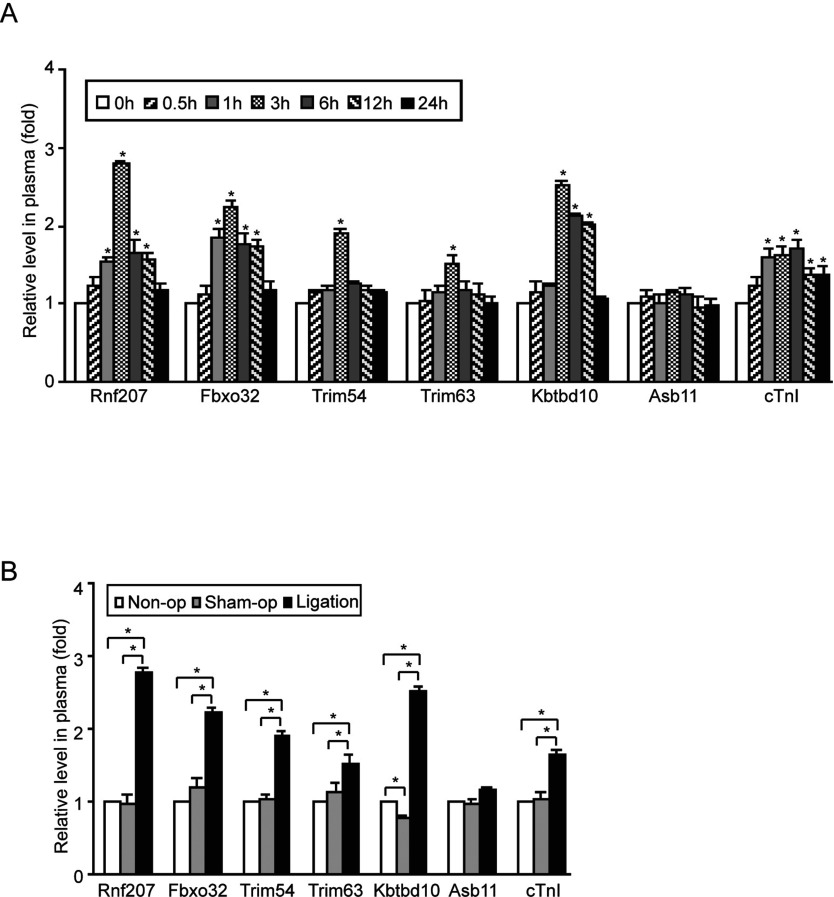
Figure 2. Measurement of plasma E3 ligases in rats with acute myocardial infarction.
(A) The plasma was collected from the rats at different times (0, 0.5, 1, 3, 6, 12 and 24 h) after coronary artery occlusion (n=8–10 per group), and the levels of circulating E3 ligases and cTnI were measured by using ELISA kit. (B) The plasma was collected from rats of non-operation (non-op), sham-operation (sham-op) and ligation groups at 3 h after coronary artery occlusion (n=5 per group). Data are expressed as mean±S.D. *, P<0.05.

