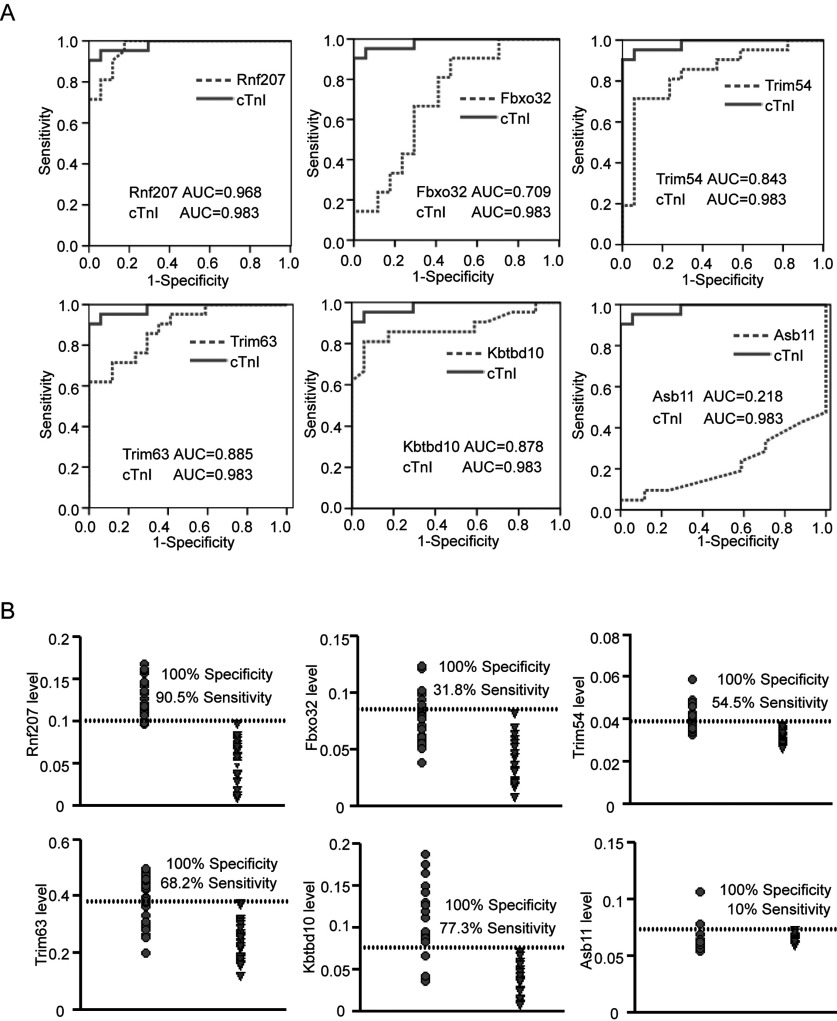
Figure 4. Evaluation of plasma E3 ligases for the diagnosis of acute myocardial infarction.
(A) Receiver operating characteristic curves (ROC) were drawn of 65 AMI patients and 28 healthy volunteers with the data of plasma ubiquitin E3 ligases. AUC, the area under curve. (B) Sensitivity and specificity of plasma ubiquitin E3 ligases levels in the diagnosis of AMI. The dashed line indicates a 100% specificity threshold. Filled circle, AMI patients; inverted triangle, healthy volunteers.

