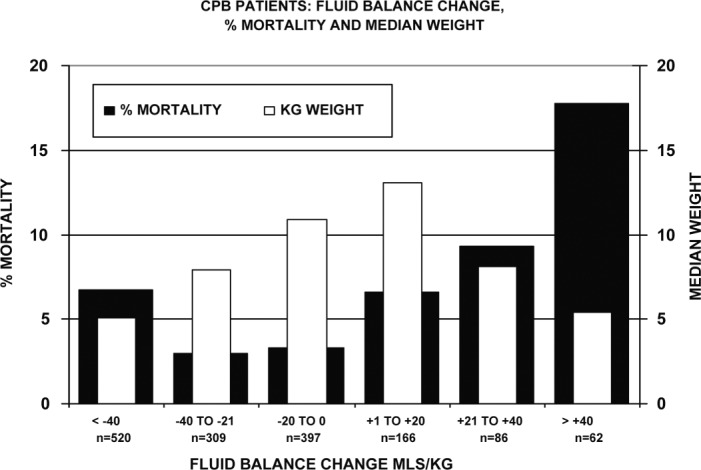
Figure 8.

CPB patients are listed by FBC category, mortality, and weight. The median weights are shown to avoid distortion of their averages by extreme outliers. Within the three negative FBC groups, patients with the greatest negative FBC had the highest mortality. Within the three positive FBC groups, patients with the greatest positive FBC had the highest mortality of any group. The total number of patients in each category is indicated by n =.
