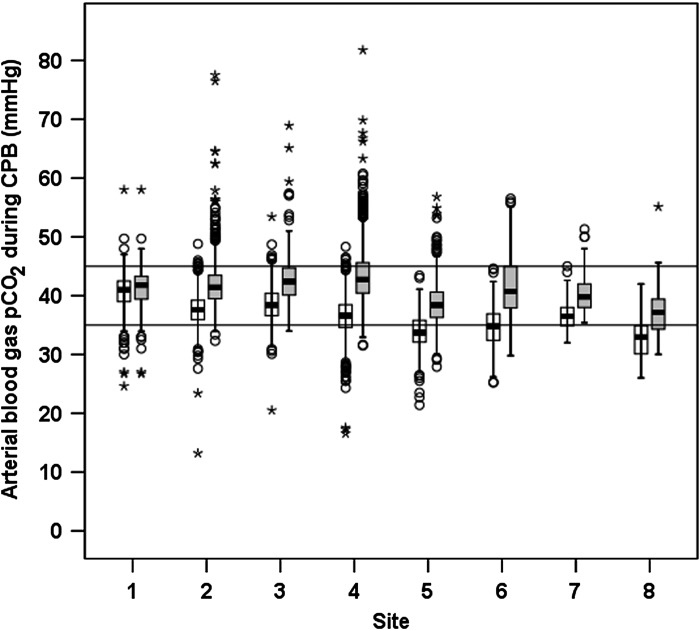
Figure 3.
Box plot of minimum and maximum arterial blood gas pCO2 during cardiopulmonary bypass for each participating site. The box indicates the interquartile range; error bars indicate the 95% confidence interval; o indicates outlier values outside of 95% confidence interval; and * indicates outlier values more than three times the interquartile range. Horizontal lines indicate targets of 35 and 45 mmHg.

