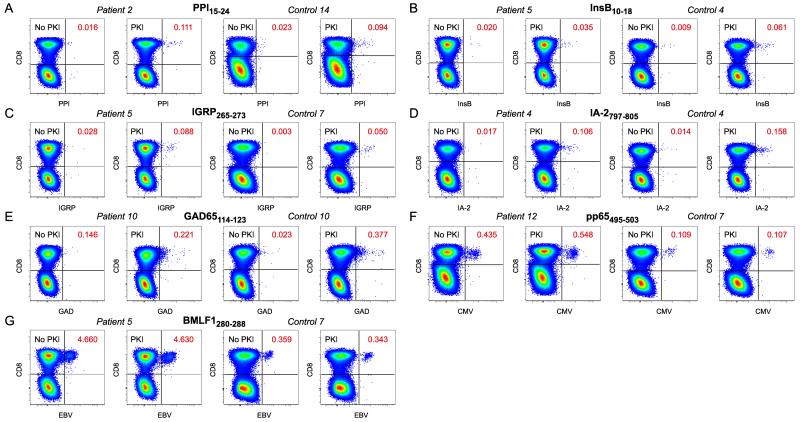
Figure 1.
Identification of antigen-specific CD8 T cell populations. A-G: Thawed PBMCs were stained with pHLA-A*0201 tetramers representing PPI15-24 (A), InsB10-18 (B), IGRP265-273 (C), IA-2797-805 (D), GAD65114-123 (E), CMV pp65495-503 (F) and EBV BMLF1280-288 (G). Gates were set serially on singlets, live CD3+CD14−CD19− cells and lymphocytes prior to Boolean exclusion of dye aggregates and subsequent analysis in bivariate CD8 versus tetramer plots (Supplementary Figure 1 A). Representative paired data in the absence or presence of dasatinib are shown for type 1 diabetes patients and healthy controls. Tetramer-binding CD8 T cell frequencies are indicated.

