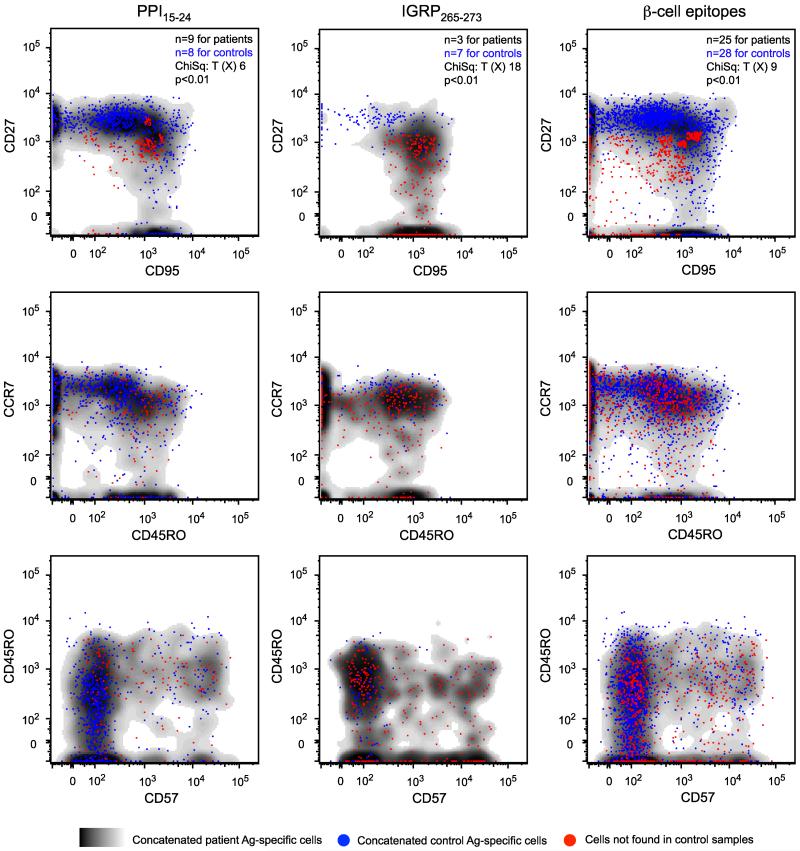
Figure 5.
Frequency difference gating analysis of antigen-specific CD8 T cells. Overlays of concatenated data from type 1 diabetes patients (cloud plots) and healthy controls (blue dots) are shown for the indicated β-cell specificities across bivariate phenotypic profiles. Populations of CD27intermediateCD95+ CD8 T cells, present at significantly higher frequencies in type 1 diabetes patients compared to healthy controls, are displayed as red dots.

