Fig. 4.

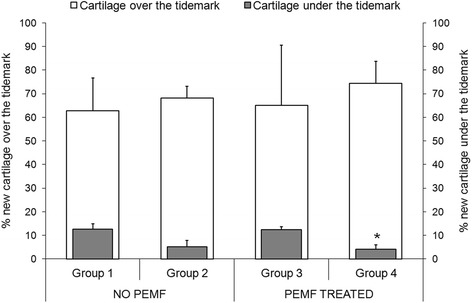
Percentage of new cartilage growth over and under the tidemark (Mean ± SD, n = 5). Mann–Whitney U test (p < 0.05): *, (new cartilage growth under the tidemark) Group 4 versus Group 1

Percentage of new cartilage growth over and under the tidemark (Mean ± SD, n = 5). Mann–Whitney U test (p < 0.05): *, (new cartilage growth under the tidemark) Group 4 versus Group 1