Fig. 2.

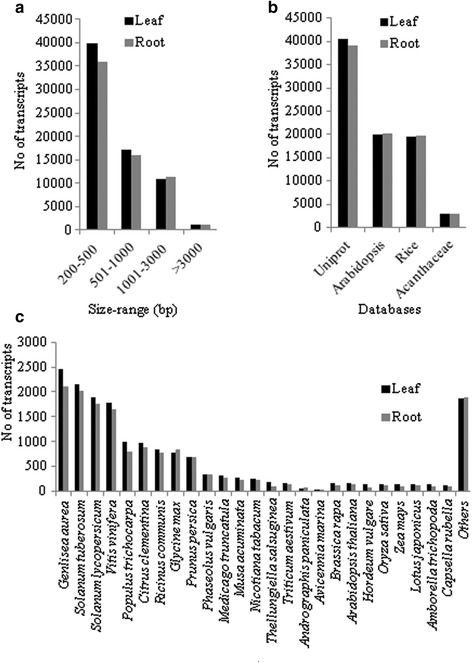
Size distribution and annotation of assembled transcripts. a Size distribution of transcripts. b Annotation of transcripts to different sequence databases was carried out on the basis of sequence similarity as determined by BLAST (version 2.2.29+) analysis. c Top-hit species distribution of transcripts showing ≥75 % sequence identity with annotated sequences of the Uniprot database
