Figure 2.
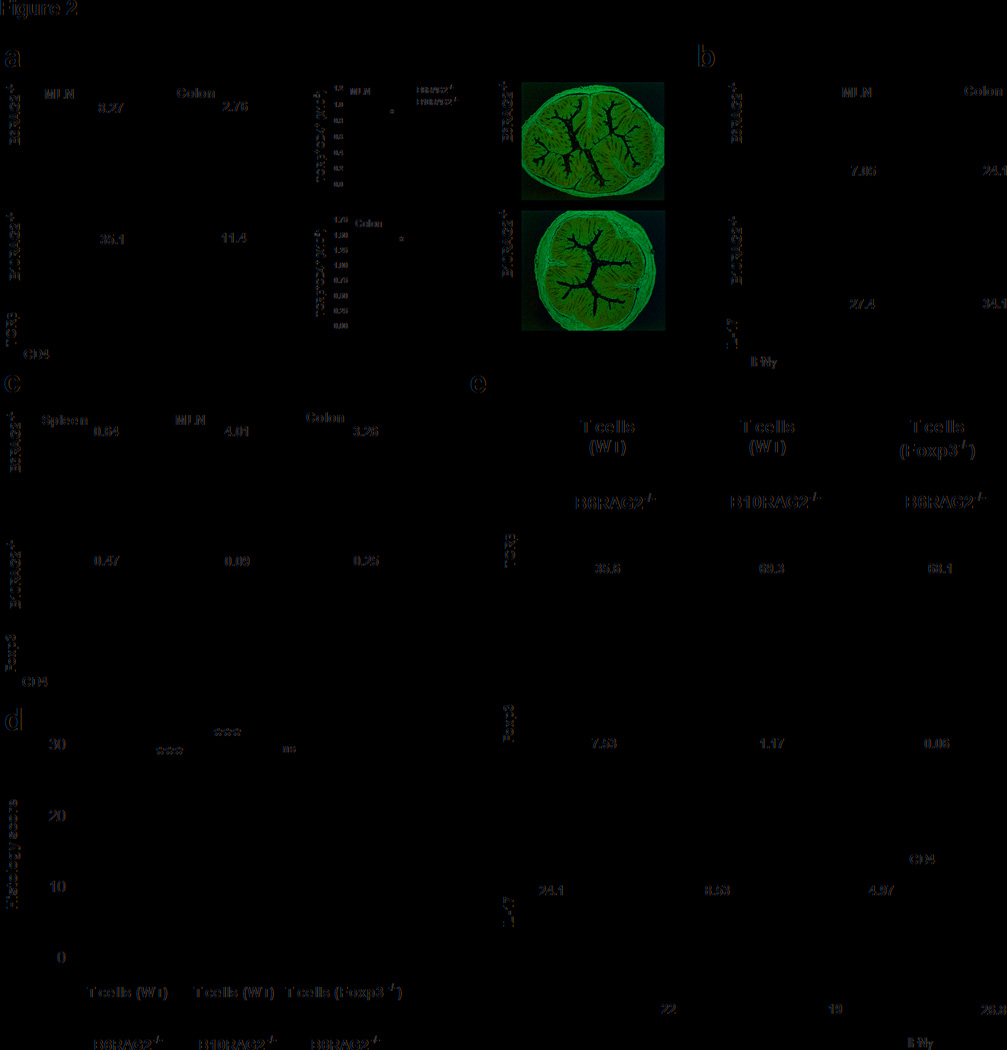
Disease severity associates with the early local balance of CD4+Foxp3+ T cells and Th1/17 cells, which depends on the ability to generate iTregs (a) Flow cytometry analysis (left panel) of lymphocytes, gated based on characteristic light-scatter properties, isolated from the indicated organs of B6 and B10-RAG2−/− recipients at week 2 after T cell transfer. Plots are representative of 5 independent experiments with 3–5 pooled mice in each. Middle panel: Total numbers of CD4+TCRβ+ T cells isolated from the indicated organs at 2 weeks after T cell transfer. Results are mean ± SEM of 3 independent experiments with 3 pooled mice in each. Right panel: Representative colon histology from at least 3 independent experiments with 3 mice in each of B6 and B10-RAG2−/− recipients at 2 weeks after T transfer (H&E-staining with original magnification 10X). (b) Cytokine production by CD4+TCRβ+ lymphocytes isolated from the indicated organs of B6 and B10-RAG2−/− mice at 2 weeks after T transfer and stimulated ex vivo for 6 hours in the presence of PMA/Ionomycin. (c) Percentage of Foxp3+ cells gated on CD4+TCRβ+ T cells isolated from the indicated organs at 2 weeks after T transfer. Plots (b and c) are representative of 5 independent experiments with 3–5 pooled mice per group in each experiment. (d) In situ expression of Foxp3 in MLNs and colonic isolated lymphoid follicles from B6 and B10-RAG2−/− at 2 weeks after T transfer (Hoechst counter-stain, original magnification 20X). Images are representative of 2 independent experiments with 3 mice in each. (e) Histology scores of Rag-deficient mice that were given Foxp3−/− or WT CD4+CD25CD45RBhigh T cells. Scores are mean ± SD of 9–15 mice in each group and representative of 2 independent experiments with similar number of mice in each. (f) Percentage of CD4+TCRβ+ (upper panel), and Foxp3+ (middle panel) lymphocytes, gated based on characteristic light-scatter properties, isolated from the MLNs of B6 and B10-RAG2−/− recipients given Foxp3−/− or WT CD4+CD25CD45RBhigh T cells at study end point (7 weeks). Lower panel: cytokine production by CD4+TCRβ+ lymphocytes isolated from the MLNs of B6 and B10-RAG2−/− mice at the study end-point and stimulated ex vivo for 6 hours in the presence of PMA/Ionomycin. Plots are representative of 2 independent experiments with 9–15 mice per group in each. Asterisks indicate statistically significant difference between the two strains (*P<0.05, ***P<0.001, ns: P>0.05).

