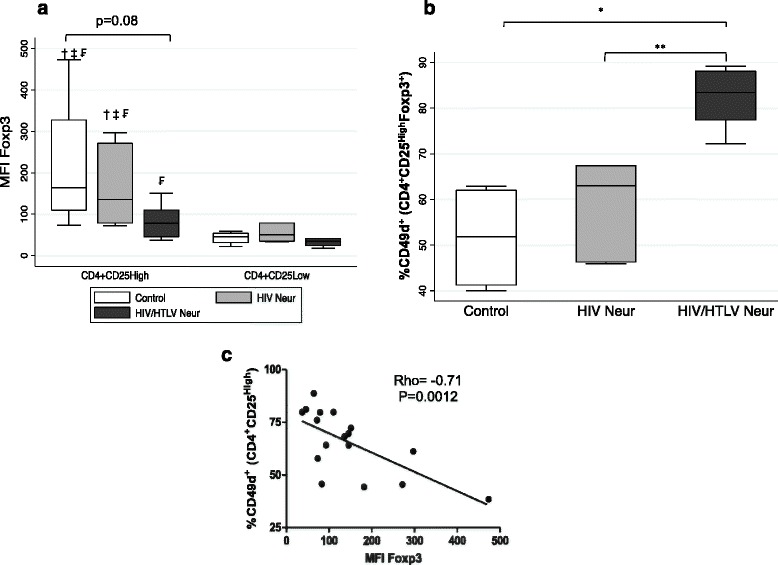
Fig. 3.

Density of FoxP3 in CD4+CD25High cells and their correlation with frequency of CD49d. In (a) median fluorescence intensity of CD4+CD25High and CD4+CD25Low cells from individuals of control (n = 4), HIV Neur (n = 7) and HIV/HTLV Neur (n = 6) groups. †, ‡ and ₣, difference statistically significant in relation to CD4+CD25Low cells from control group, HIV Neur and HIV/HTLV Neur, respectively. Note that there is a significant difference in the density of Foxp3 expression between CD4+CD25High and CD4+CD25Low cells in the same group. In (b) frequency of CD49d in Treg cells. *p < 0.05, **p < 0.001. In (c) correlation between CD49d and density of FoxP3 expression in CD4+CD25High cells, obtained as the median fluorescence intensity (MFI)
