Fig. 2.

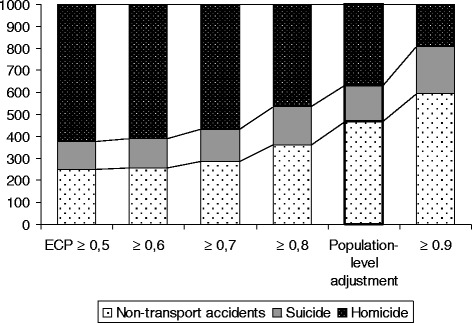
Distributions of the three imputed causes of death (both sexes) depending on constraints on the estimated classification probability, per 1000 cases

Distributions of the three imputed causes of death (both sexes) depending on constraints on the estimated classification probability, per 1000 cases