
Figure 2.
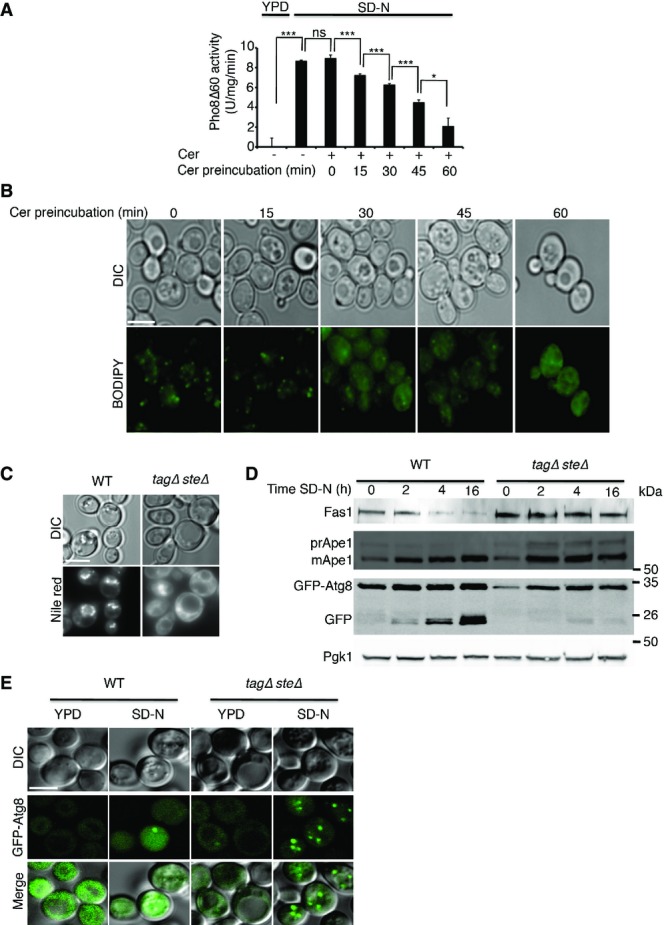
Lipid droplets are important for autophagy
- Cells (TN124 strain) were grown to mid-log phase and preincubated in YPD with 50 μM cerulenin for the indicated time periods (Cer preincubation) or incubated with DMSO without preincubation (−). Cells were then shifted to SD-N for 3 h with the addition of DMSO or 50 μM cerulenin (cer). Autophagic activity was measured by alkaline phosphatase assay. Error bars represent the s.e.m. of three independent experiments. *P < 0.05, ***P < 0.001 (Student’s t-test).
- Cells were grown as in (A), stained with BODIPY, and visualized by fluorescence microscopy. Scale bar, 5 μm.
- WT (SCY62) and tagΔsteΔ (H1246) cells were grown to mid-log phase in YPD and shifted to SD-N for 3 h. Cells were stained with Nile red and visualized by fluorescence microscopy. Scale bar, 5 μm.
- WT (SCY62) and tagΔsteΔ (H1246) cells expressing GFP-Atg8 were grown to mid-log phase in YPD and shifted to SD-N for the indicated time periods. Cell lysates were subjected to SDS–PAGE, followed by Western blot analysis using anti-GFP, anti-Ape1 (prApe1, premature Ape1; mApe1, mature Ape1), and anti-Fas1 and anti-Pgk1 antibodies.
- WT (SCY62) and tagΔsteΔ (H1246) cells were grown to mid-log phase in YPD and shifted to SD-N for 2 h. GFP-Atg8 was visualized by fluorescence microscopy. Scale bar, 5 μm.
Data information: cer, cerulenin; DIC, differential interference contrast; FA, fatty acids; SD-N, nitrogen starvation medium; WT, wild type; YPD, complete medium. Source data are available online for this figure.