
Figure 5.
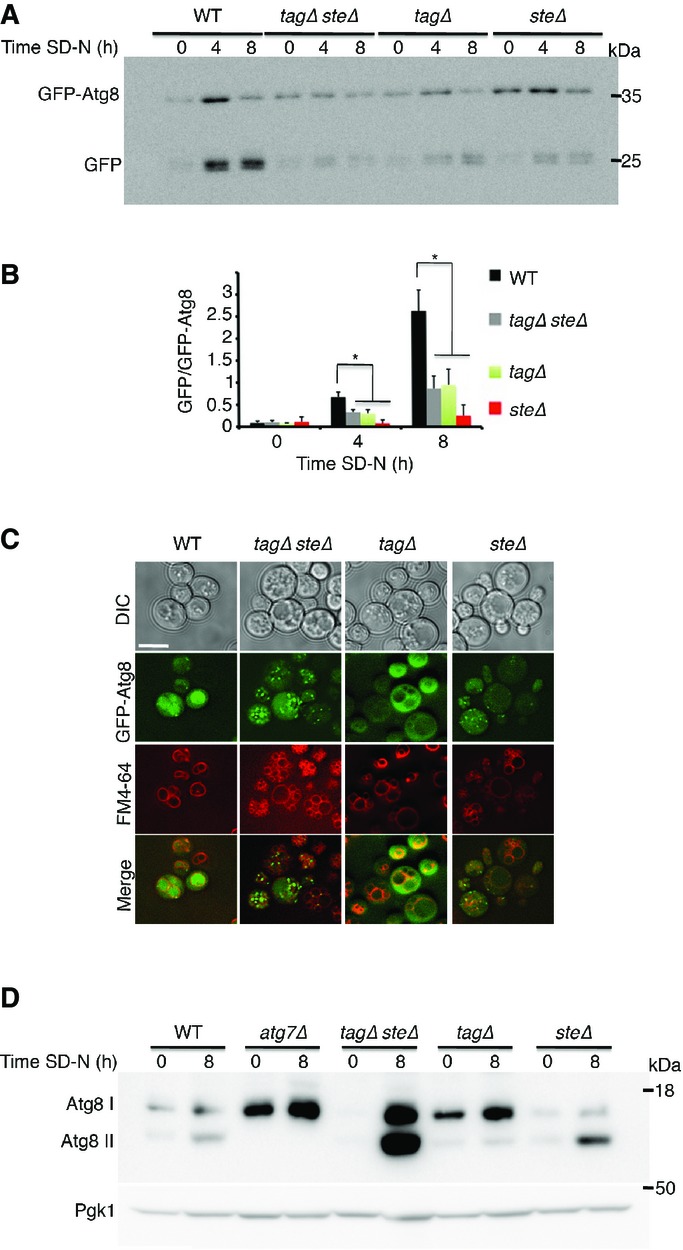
TAG and STE are both essential for efficient autophagy
- WT (SCY62), tagΔsteΔ (H1246), tagΔ (H1226), and steΔ (H1112) cells expressing GFP-Atg8 were grown to mid-log phase in YPD and shifted to SD-N for the indicated time periods. Cells were lysed and subjected to SDS–PAGE, followed by Western blot analysis using anti-GFP antibodies.
- Quantification of the GFP/GFP-Atg8 ratio. Error bars represent the s.e.m. of three independent experiments. *P < 0.05 (Student’s t-test).
- WT (SCY62), tagΔsteΔ (H1246), tagΔ (H1226), and steΔ (H1112) cells expressing GFP-Atg8 were grown to mid-log phase in YPD and shifted to SD-N for 2 h. GFP-Atg8 was visualized by fluorescence microscopy. Scale bar, 5 μm.
- WT (SCY62), tagΔsteΔ (H1246), tagΔ (H1226), and steΔ (H1112) cells were grown as in (A). Lysates were subjected to SDS−PAGE in urea gel, followed by Western blot analysis using anti-Atg8 and anti-Pgk1 antibodies.
Data information: Atg8 I, non-lipidated Atg8; Atg8 II, lipidated Atg8; DIC, differential interference contrast; SD-N, nitrogen starvation medium; WT, wild type. Source data are available online for this figure.