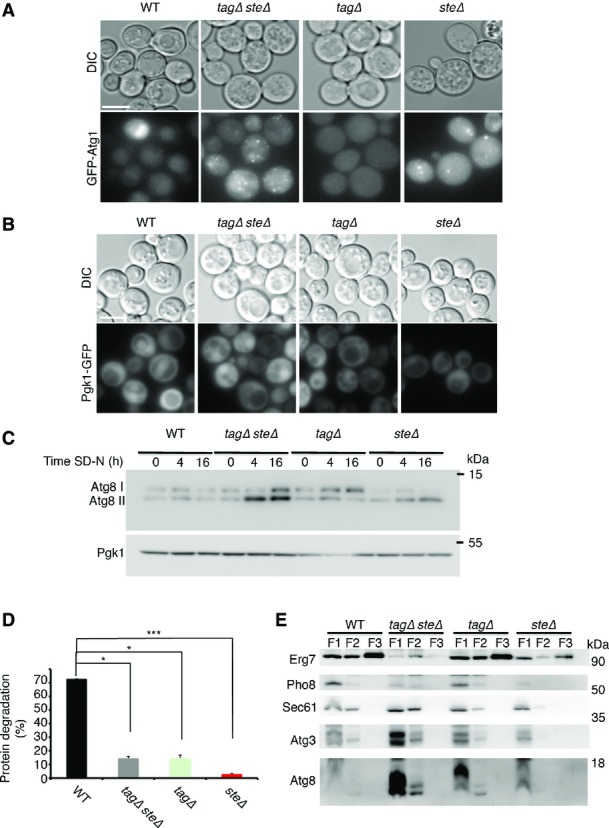
TAG and STE are both essential for efficient autophagy
- A, B WT (SCY62), tagΔsteΔ (H1246), tagΔ (H1226), and steΔ (H1112) cells expressing Atg1-GFP (A) or Pgk1-GFP (B) were grown to mid-log phase in YPD and shifted to SD-N for 2 h. GFP was visualized by fluorescence microscopy. Scale bar, 5 μm.
- C WT (SCY62), tagΔsteΔ (H1246), tagΔ (H1226), and steΔ (H1112) cells were grown to mid-log phase in YPD and shifted to SD-N for the indicated time periods. Lysates were subjected to SDS–PAGE in urea gel, followed by Western blot analysis using anti-Atg8 and anti-Pgk1 antibodies.
- D WT (SCY62), tagΔsteΔ (H1246), tagΔ (H1226), and steΔ (H1112) cells were grown to mid-log phase in YPD and pulse-labeled for 16 h with [35S] methionine and cysteine. Cells were chased on non-radioactive starvation medium. Acid-soluble small peptides generated by proteolysis were determined after 8 h in SD-N, as described in Materials and Methods. Error bars represent the s.e.m. of three independent experiments. *P < 0.05, ***P < 0.001 (Student’s t-test).
- E WT (SCY62), tagΔsteΔ (H1246), tagΔ (H1226), and steΔ (H1112) cells were grown to mid-log phase in YPD and shifted to SD-N for 4 h. Cells were lysed and lipid droplets were isolated by three successive flotations (F1, F2, F3) as described in Materials and Methods. The flotation fractions were subjected to SDS–PAGE, followed by Western blot analysis using anti-Atg8, anti-Sec61, anti-Erg7, anti-Atg3, and anti-Pho8 antibodies. WT sucrose %: 1–8.4%, 2–13%, 3–19.5%, 4–23.8%, 5–26%, 6–28.5%, 7–28.8%, 8–29.5%, 9–32%, 10–34.2%, 11–39.5%, 12–48.5%, 13–48.5%. tagΔsteΔ sucrose %: 1–8.4%, 2–12%, 3–13%, 4–18.5%, 5–23.8%, 6–26.5%, 7–28.2%, 8–31%, 9–31.5%, 10–33.8%, 11–38%, 12–45%, 13–48%.
Data information: SD-N, nitrogen starvation medium; WT, wild type; YPD, complete medium. Source data are available online for this figure.
