Figure 6.
Dynamin 2 is a transition controller for WAVE/N-WASP recruitment
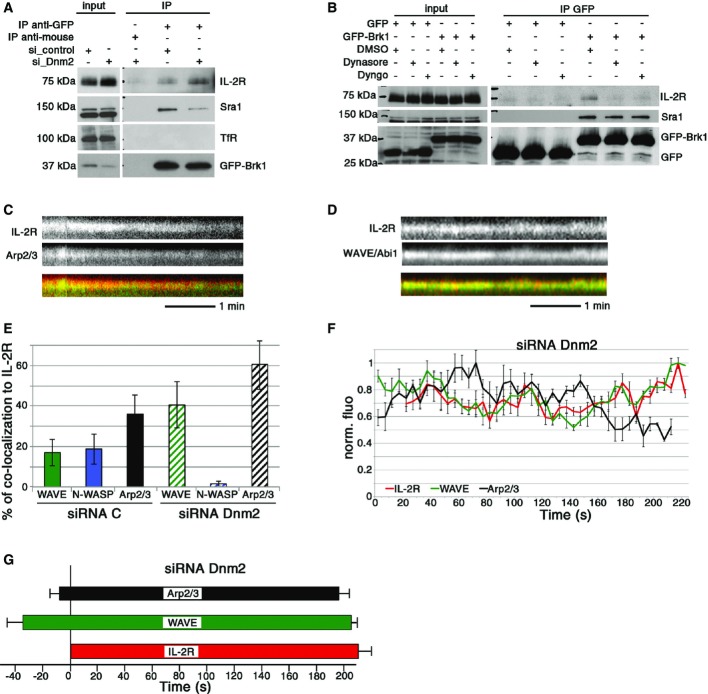
- A Hep2β cells were transfected with siRNA control or against dynamin 2 (siDnm2.2) and then transfected 48 h later with either GFP-Brk1 or GFP. Co-immuno-precipitation, Western blots were performed as described in Fig4.
- B Hep2β cells transfected with GFP-Brk1 or GFP were serum-starved and then incubated with 80 μM dynasore, 30 μM dyngo or DMSO as a control. Co-immuno-precipitation, Western blots were performed as described in Fig4.
- C–G Automated analysis of TIRF images of cells treated with siRNA control or siRNA Dnm2.1 using Icy software was done on 10 cells, analysing around 1,000 IL-2R tracks per condition. (C, D) Representative kymographs of Arp2/3-IL-2R track or of WAVE-IL-2R track. (E) Percentage of co-localized WAVE, N-WASP or Arp2/3 tracks to IL-2R. (F) Average fluorescence intensity profiles of WAVE and Arp2/3 with respect to IL-2R tracks using normalized fluorescence intensities for each track (time 0 is arbitrarily determined by the first track recruited, mean of 10 tracks, ± SE). (G) Mean time of appearance/departure of WAVE and Arp2/3 co-localized to IL-2R tracks, time = 0 represents the initiation IL-2R track (mean ± SE based on the analysis of around 1,000 IL-2R tracks).

