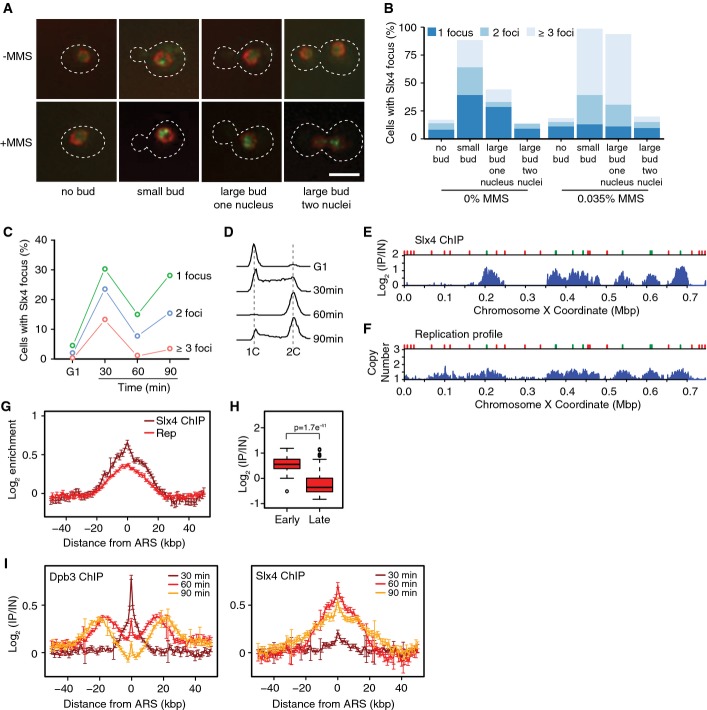
Figure 1.
Slx4 is recruited behind replication forks during MMS-induced DNA replication stress
- Intracellular localization of Slx4-GFP in logarithmic phase cells, either untreated or treated for 90 min with 0.035% MMS. Examples of cells with the indicated morphologies are shown. The nuclear periphery is marked with Nup49-RFP, the outline of the cells is indicated by the dashed line, and the scale bar indicates 5 μm.
- Slx4-GFP foci were quantified in logarithmic phase cells, either untreated or treated for 90 min with 0.035% MMS. Cells with each of the indicated morphologies were assessed, and the fraction of cells with each morphology that had 1, 2, or ≥ 3 foci is plotted. 477 (-MMS) and 619 (+MMS) cells were evaluated in the experiment shown, which is a representative of two replicates.
- Cells were arrested in G1 and released synchronously into the cell cycle. The fraction of cells with 1, 2, or ≥ 3 Slx4-GFP foci was quantified at the indicated times, and the average of three replicates is plotted.
- The DNA contents of cells from the samples in (C) were measured by flow cytometry and are plotted as histograms. The positions of 1C and 2C DNA contents are indicated.
- ChIP-seq analysis was performed following synchronous release of SLX4-FLAG cells into S phase in the presence of 0.035% MMS for 60 min. Slx4 ChIP enrichment scores on chromosome 10 are shown. Early origins are indicated by green bars and late origins by red bars.
- The replication profile compares the relative copy number of DNA sequences in the input sample from the SLX4-FLAG cells released into S phase in the presence of 0.035% MMS for 60 min to a DNA sample prepared from G1-arrested wild-type cells. Copy number along chromosome 10 is plotted.
- The median (± standard error) Slx4 ChIP enrichment score and replication profile (Rep) across n = 108 early-firing origins, in wild-type cells, are plotted.
- The distributions of Slx4 ChIP enrichment scores at early- and late-firing origins genome-wide are shown as a boxplot. The median is indicated by the horizontal bar, the box spans the first through third quartiles, the whiskers extend to the last data points within 1.5 times the interquartile range, and outliers are plotted as circles. The distributions were compared using the Wilcoxon rank-sum test.
- ChIP-seq analysis was performed on DPB3-FLAG and SLX4-FLAG cells at 30, 60, and 90 min following synchronous release into S phase in the presence of 0.035% MMS. The median (± standard error) Dpb3 (left) and Slx4 (right) ChIP enrichment score across n = 108 early-firing origins are plotted.

