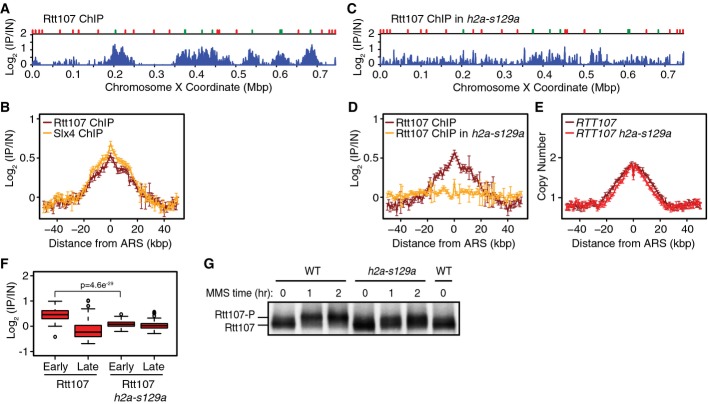
Figure 3.
Phosphorylated histone H2A recruits Rtt107 behind replication forks during MMS-induced DNA replication stress
- ChIP-seq analysis was performed following synchronous release of RTT107-FLAG cells into S phase in the presence of 0.035% MMS for 60 min. Rtt107 ChIP enrichment scores on chromosome 10 are shown. Early origins are indicated by green bars and late origins by red bars.
- The median (± standard error) Rtt107 ChIP enrichment scores are plotted with the median (± standard error) Slx4 ChIP enrichment scores across n = 108 early-firing origins, in wild-type cells.
- ChIP-seq analysis was performed following synchronous release of RTT107-FLAG h2a-s129a cells into S phase in the presence of 0.035% MMS for 60 min. Rtt107 ChIP enrichment scores on chromosome 10 are shown.
- The median (± standard error) Rtt107 ChIP enrichment scores are plotted across n = 108 early-firing origins, for wild-type and h2a-s129a cells.
- The median (± standard error) replication profile across n = 108 early-firing origins is plotted for wild-type and h2a-s129a cells.
- The distributions of Rtt107 ChIP enrichment scores at early- and late-firing origins genome-wide are shown as boxplots. The median is indicated by the horizontal bar, the box spans the first through third quartiles, the whiskers extend to the last data points within 1.5 times the interquartile range, and outliers are plotted as circles. The distributions were compared using the Wilcoxon rank-sum test.
- Immunoblot analysis of Rtt107-FLAG in wild-type and h2a-s129a cells before and after treatment of asynchronous cultures with 0.035% MMS for the indicated times.
Source data are available online for this figure.

