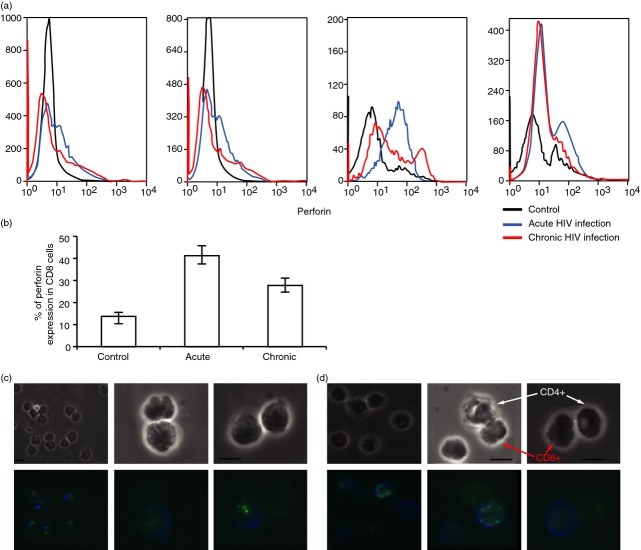
Figure 4.
Perforin expression in CD8 T cells from peripheral blood mononuclear cells (PBMC) of acute and chronic HIV-infected patients and healthy controls. (a) FACS analysis of perforin expression in CD8 T cells in acute HIV infection (blue), chronic HIV infection (red), and non-infected controls (black) (four different experiments are presented). (b) Statistical analysis of perforin expression in sorted CD8 T cells of acute and chronic HIV-infected patients and healthy controls (average ± SE), bars with different letters differ at P < 0·05 (Tukey–Kramer test). (c) Immunofluorescence of CD8 (blue) and perforin (green) in conjugated CD8–CD4 T cells of acute and (d) chronic HIV-infected patients. Each scale bar is 10 μm.

