Figure 3.
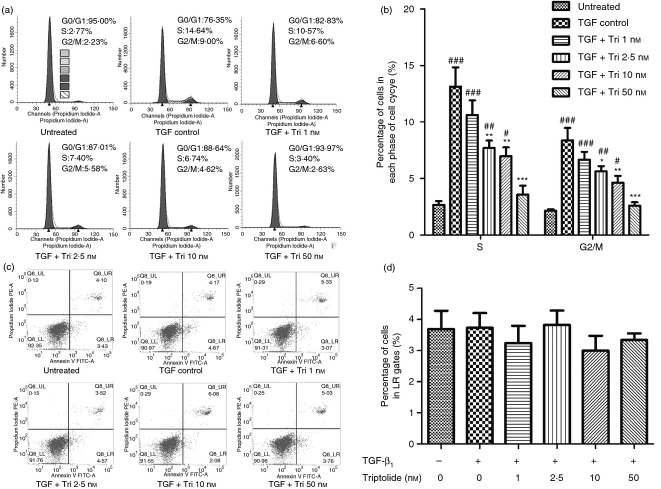
FACS analysis of cell cycle and apoptosis. Transforming growth factor-β1 (TGF-β1) -stimulated cells that were pre-treated with triptolide were cultured for 24 hr. After that, cell cycle was determined by individual nuclear DNA content reflected by fluorescence intensity of incorporated propidium iodide. Apoptosis was determined by Annexin V FITC and PI staining. (a) Images show one representative profile of cell cycle distribution in three independent experiments. (b) The percentage of cell cycle distribution after the indicated treatment. Cells with single and doubled DNA contents were defined in G0/G1 and G2/M phase, respectively, and were classified to S phase with DNA content between them. Data were analysed automatically using computer software and are presented as the mean ± SEM (#P < 0·05, ##P < 0·01, ###P < 0·001, versus untreated group; *P < 0·05, **P < 0·01, ***P < 0·001 versus TGF control group). (c) Images show one representative profile of cell apoptosis rate in three independent experiments. The early and late apoptosis was quantified and indicated in UL and LR gates, respectively. The critical values were determined by the control samples without any staining. (d) Date of apoptosis rates of cells (cells in LR gate) is shown. There was no statistical significance among groups.

