
Figure 6.
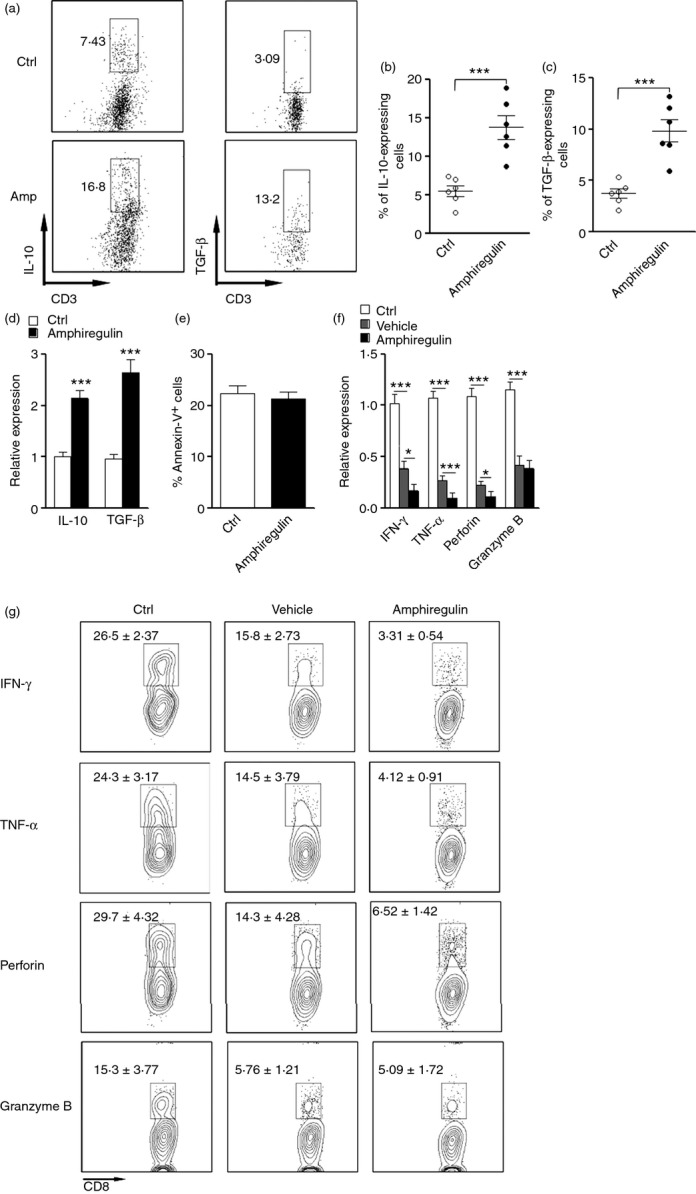
Amphiregulin enhances the immunosuppressive activity of epidermal growth factor receptor positive (EGFR+) regulatory T (Treg) cells to inhibit CD8+ T-cell-mediated anti-viral function. (a) Representative dot plots showing interleukin-10 (IL-10) and transforming growth factor-β (TGF-β) staining in EGFR+ Treg cells. FACS sorted intrahepatic CD4+ CD25+ Treg cells were culture in vitro in the presence or absence of 100 ng/ml Amphiregulin for 24 hr. Surface staining for CD3 and intracellular staining for IL-10 and TGF-β were then conducted. CD3+ cells were gated. Numbers in the dot plots are the percentage of IL-10-expressing or TGF-β-expressing cells. Ctrl, without amphiregulin; Amp, with amphiregulin. (b, c) Statistical analysis for proportion of IL-10-expressing (b) and TGF-β-expressing (c) cells in cultured Treg cells. Each dot represents an individual mouse. (d) mRNA levels of IL-10 and TGF-β in cultured Treg cells; n = 6 per group. (e) Percentage of Annexin V+ cells in Treg cells after culture; n = 6 per group. Ctrl, Treg cells cultured without amphiregulin; Amphiregulin, Treg cells cultured with amphiregulin. (f) mRNA levels of anti-viral components in CD8+ T cells after co-culture with intrahepatic CD4+ CD25+ Treg cells. Ctrl, CD8+ T cells culture without Treg cells; Vehicle, CD8+ T cells co-cultured with Treg cells but without amphiregulin; Amphiregulin, CD8+ T cells co-cultured with Treg cells with amphiregulin. (g) Representative FACS quadrant plots for the expression of interferon-γ (IFN-γ), tumour necrosis factor-α (TNF-α), perforin and granzyme B in CD8+ T cells co-cultured with Treg cells. Number in each plot is the frequency (mean ± SEM) of T cells expressing corresponding proteins; n = 5 per group. *P < 0·05; **P < 0·01; ***P < 0·001.