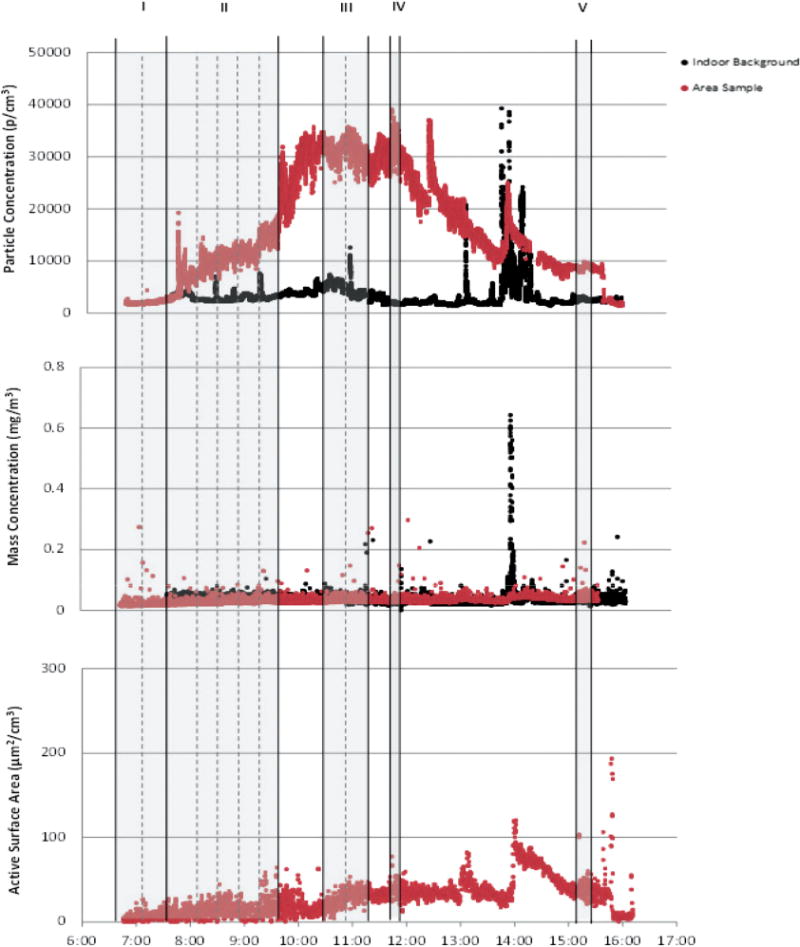
Fig. 3.

Time series of particle number, respirable mass, and active surface area during the five highlighted processes: (I) MWCNT Production-B, (II) MWCNT Production-A, (III) Harvesting MWCNTs, (IV) Harvesting DWCNTs, and (V) Harvesting MWCNTs (second batch). Solid black lines denote processes (Table 1), while dotted lines denote subtasks (Table 3). Red data consist of at-source samples of processes. Black data are corresponding outdoor background sample.
