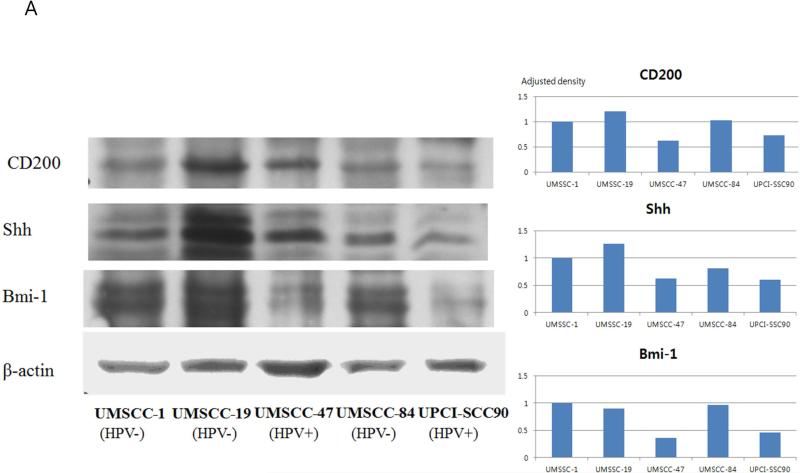
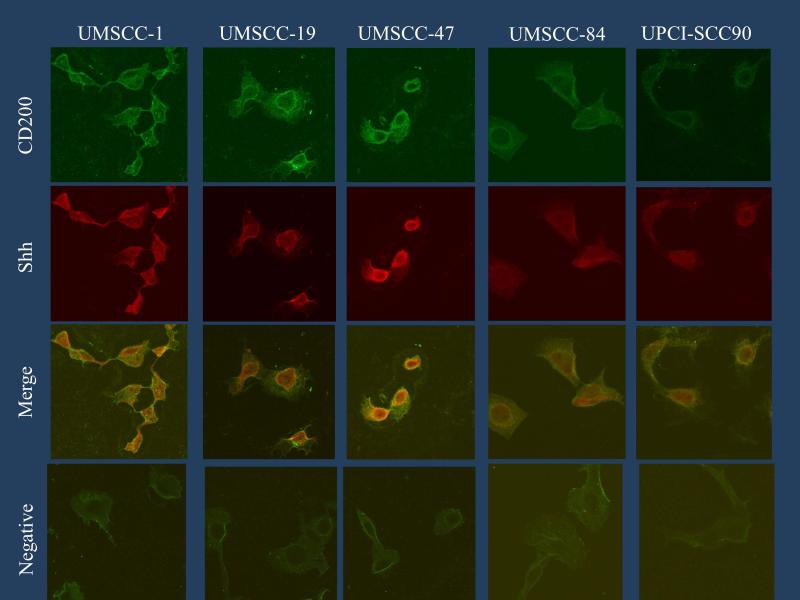
FIGURE 1.
CD200 expression in HNSCC cell lines and association with the expressions of Shh and Bmi-1. (A) Western blot analyses of CD200, Shh, and Bmi-1 and actin controls are shown for multiple HNSCC cell lines with various HPV status. Adjusted densities of each blots were graphed, being those of UMSCC-1 as a reference. (B) Immunofluorescence of the same cancer cells.


