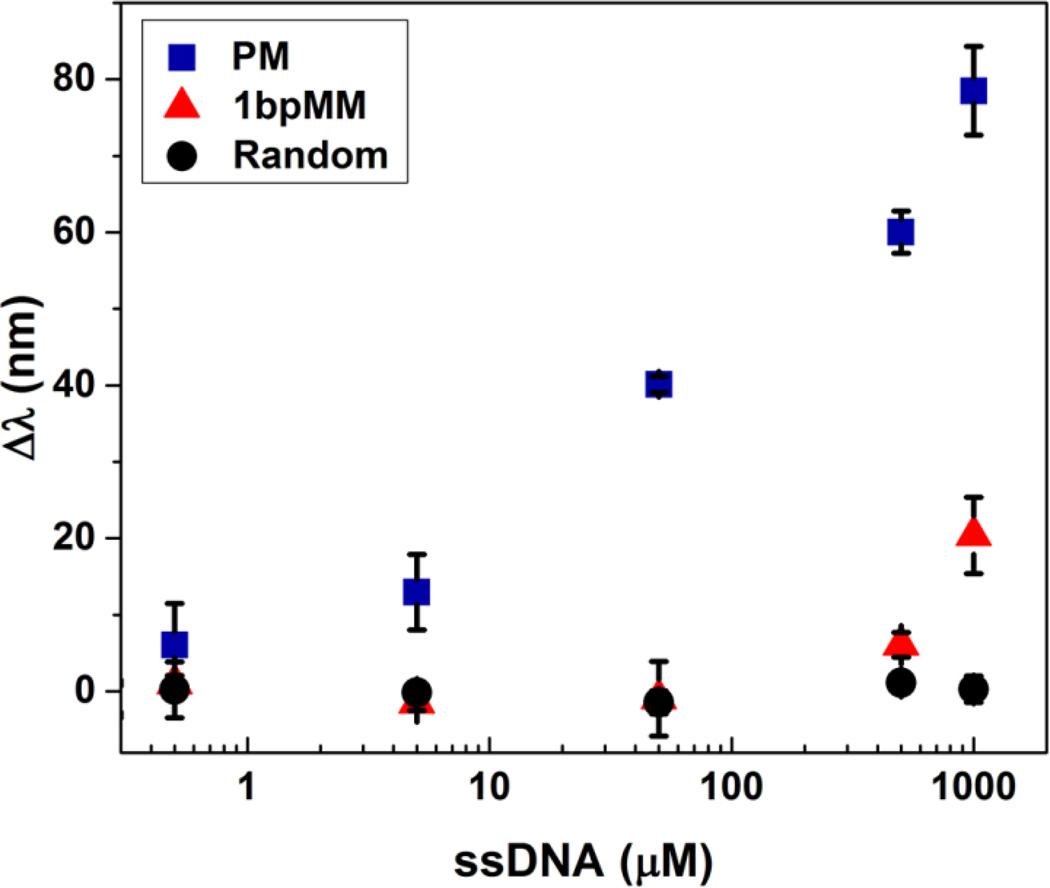
Figure 2.
Change in wavelength of peak diffraction relative to that of the probe functionalized sensor as a function of the concentration of target ssDNA. Samples were annealed at a rate of 0.2 °C/min with PM, 1bpMM, or random target DNA concentrations ranging from 0.5 to 1000 µM. Diffraction measurements were taken in a 0.25 mM NaCl solution at pH 6 and at room temperature. Error bars represent ±1σ from the mean of 3 samples.

