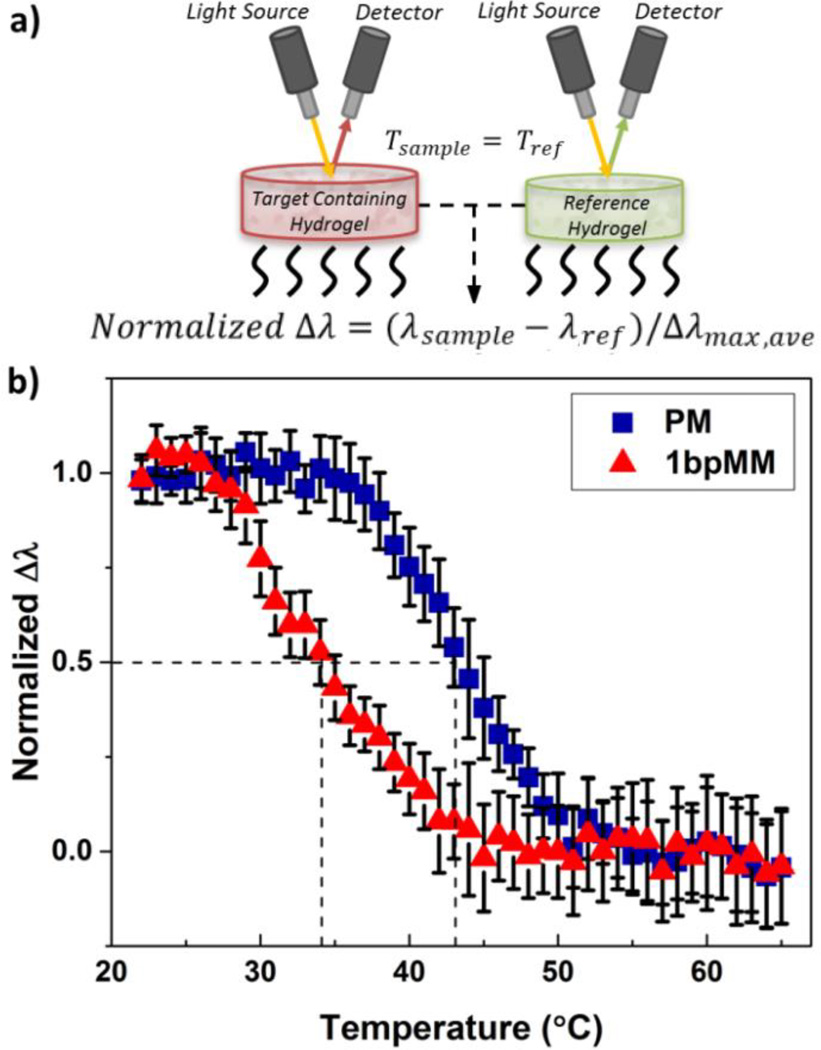
Figure 4.
a) Schematic of the optical setup for characterizing melting curves and b) normalized melting curves for samples annealed with PM or 1bpMM target DNA. The normalized optical response was calculated as the difference in peak diffraction between the target containing samples and reference samples, normalized to the average maximum shift for the PM and 1bpMM samples. The Tm for the hybridized PM (blue squares) and 1bpMM (red triangles) was found to be 43.5 and 34.3 °C, respectively. Sample annealing was performed prior to melting with 50 µM PM or 500 µM 1bpMM target DNA at a rate of 0.2 °C/min. Melting was performed by ramping samples from room temperature to 65 °C at a rate of 0.25 °C/min. Diffraction measurements were taken in a 2.5 mM NaCl solution at pH 6. Error bars represent ±1σ from the mean of 3 samples.

