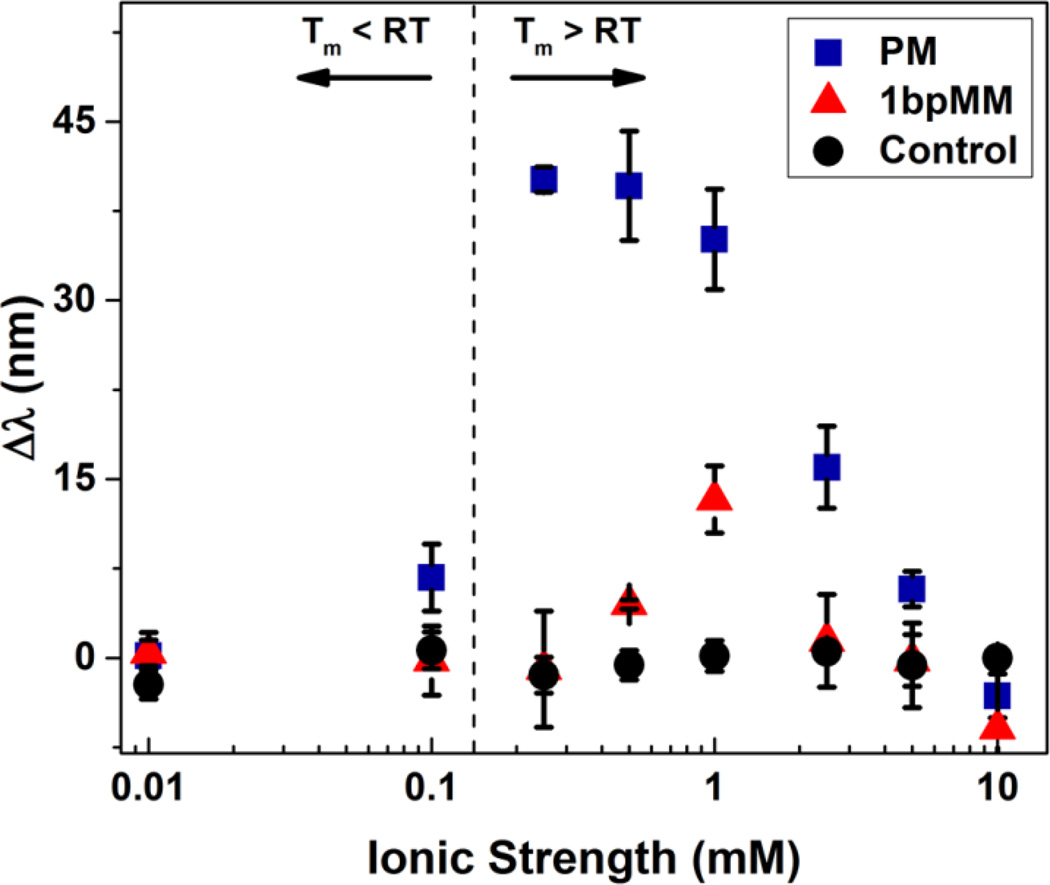
Figure 5.
Optical response Δλ as a function of ionic strength for samples annealed with 50 µM PM (blue squares) or 1bpMM (red triangles) target DNA annealed at a ramp rate of 0.2 °C/min. Control samples (black circles) included probe functionalized hydrogels annealed in the absence of target DNA and hydrogels that were not functionalized with probe but annealed in the presence of target DNA. The vertical dashed line indicates the ionic strength conditions at which the melting temperature of the PM target DNA is equal to the optical characterization temperature. Diffraction measurements were taken after sample equilibration in 0.01 to 10 mM NaCl solutions at pH 6 and at room temperature. Error bars represent ±1σ from the mean of 3–6 samples.

