
Fig. 1.
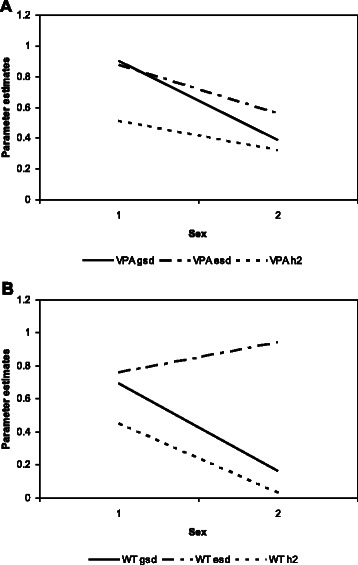
Genotype × sex interaction effects and sex-specific heritabilities for VPA and WT. a. VPA. b. WT. Parameter estimates on the vertical axis plotted against sex on the horizontal axis. Male and female sexes are coded respectively as 1 and 2. Additive genetic and environmental standard deviations (gsd and esd, respectively) are respectively given by the solid and dot-dashed lines, and sex-specific heritabilities (h2) are given by the dotted lines