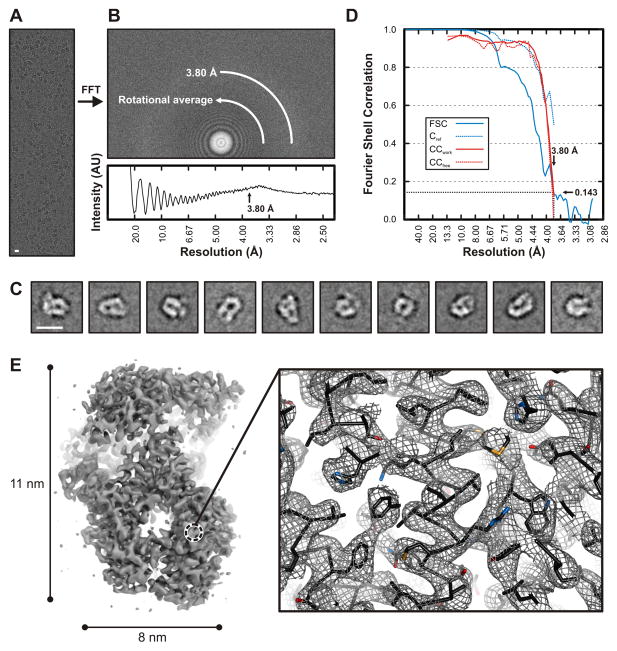
Figure 1. Electron cryomicroscopic reconstruction of VSV-L at 3.8 Å resolution.
(A) Raw image of VSV-L particles in vitreous ice recorded at 1.8 μm defocus (scale bar = 10 nm).
(B) Power spectrum of the image shown in (A), with plot of the rotationally averaged intensity versus resolution. Arrow indicates the spatial frequency corresponding to 3.8 Å resolution.
(C) Representative class averages (scale bar = 10 nm).
(D) Fourier shell correlation analysis: FSC, correlation between the half-set 3-D reconstructions (solid blue line); Cref, estimated correlation between the final map and a perfect reference map containing no errors, calculated from FSC (dotted blue line) (Rosenthal and Henderson, 2003); CCwork (solid red line) and CCfree (dotted red line), correlation between the final map and refined model for working and test set of structure factors, respectively.
(E) Right, overview of VSV-L reconstruction. In the view shown, the particle (240 kDa) is molecular weight of the VSV-L protein is approximately 110 Å long and 80 Å wide. Right, close-up view of a representative region in the polymerase domain (RdRp). The volume shown in close-up is from the protein interior, not on the RdRp surface. Density is shown as gray mesh; polypeptide-chain backbone of the refined model, as black ribbon; side-chain atoms, as sticks (carbons, black; nitrogen, blue; oxygen, red; sulfur, orange).
Note the continuous backbone density, α-helical grooves and resolution of bulky side chains -- features that allowed building and stereochemical refinement of the atomic model.

