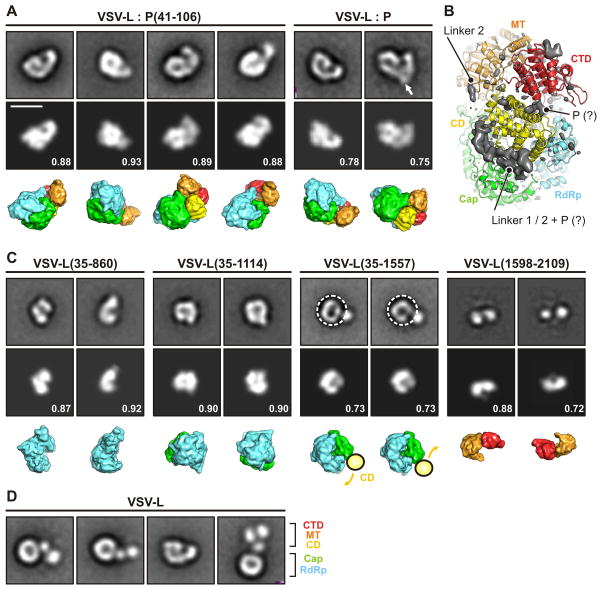
Figure 5. Domain reorganization.
(A) Projection angle matching between class averages of negatively stained complexes of VLS-L and P protein (top row) (Rahmeh et al., 2012; Rahmeh et al., 2010) and projections calculated from the model (middle row). The bottom row shows the model in the same orientation with the individual domains colored as in Fig. 2. Numbers are correlation coefficients between model and negative-stain class averages. VLS-L:P(35–106) corresponds to the structure determined here. In the panel for VLS-L:P, an arrow indicates additional density observed in some class averages that we attribute to the bound P dimer. Scale bar = 10 nm.
(B) Difference density map (mapobserved - mapmodel) calculated to 5 Å resolution and shown together with the model. The map shows density present in the image reconstruction that could not be fit with a molecular model. Strong density -- presumably from linkers 1 and 2, which enter and leave this density at defined points, and with potential contribution from P (tentative assignment indicated by “?”) -- lines the groove between capping and connector domains. We have not attempted to interpret the small, low-resolution feature at the upper right.
(C) Projection angle matching of VSV-L fragments. For VSV-L(35–1557), the negative-stain class averages suggest a conformationally variable connection between the connector domain (CD) and the polymerase (RdRP) and capping domain (Cap). We therefore selected only the “doughnut” part of the image and aligned residues 35–1334.
(D) Full-length VSV-L without P. CD, MT and CTD extend in variable orientation from the RdRp-Cap doughnut.

