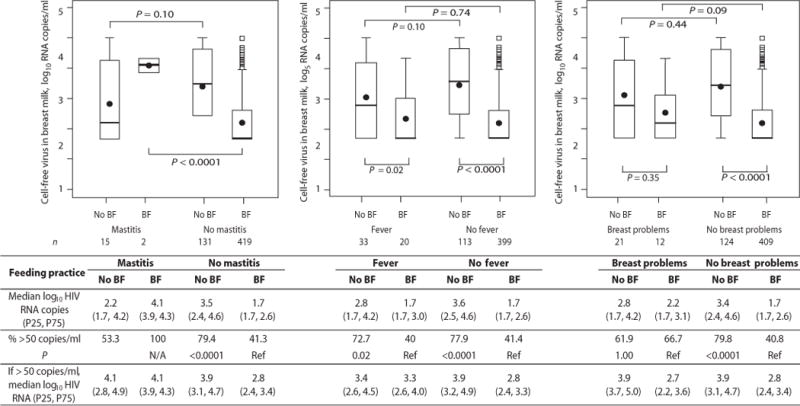
Fig. 4.

Concentrations of cell-free HIV-1 RNA in breast milk at 4.5 months from HIV-1 infected women who had stopped breastfeeding (No BF) and continued breastfeeding (BF) among those who did and did not have mastitis, fever or any breast problems at 4.5 months. The numbers of samples analyzed in each group are shown below the box plot. P-values from Wilcoxon tests are shown for corresponding box pairs. The thick horizontal bar represents the median value and the dot the mean; the bottom and top of each box represents the 25th and 75th percentiles; the lower and upper bars of each box represent the minimum values within 1.5 times the inter-quartile range. Observations beyond 1.5 times the IQR are shown as outliers. Actual values for the median and 25th and 75th percentiles (overall and only among those above detection) of cell-free HIV-1 RNA in each group are shown in the table. The table also shows the proportions with breast milk HIV-1 RNA concentrations >50 copies/ml in each group. Chi-squared tests were used to calculate the p-values comparing the proportions with breast milk HIV-1 concentrations above the detection threshold by breastfeeding status within each stratum (no mastitis, fever, no fever, breast problems, no breast problems) separately. P-value was not calculated in the mastitis stratum due to small sample size.
