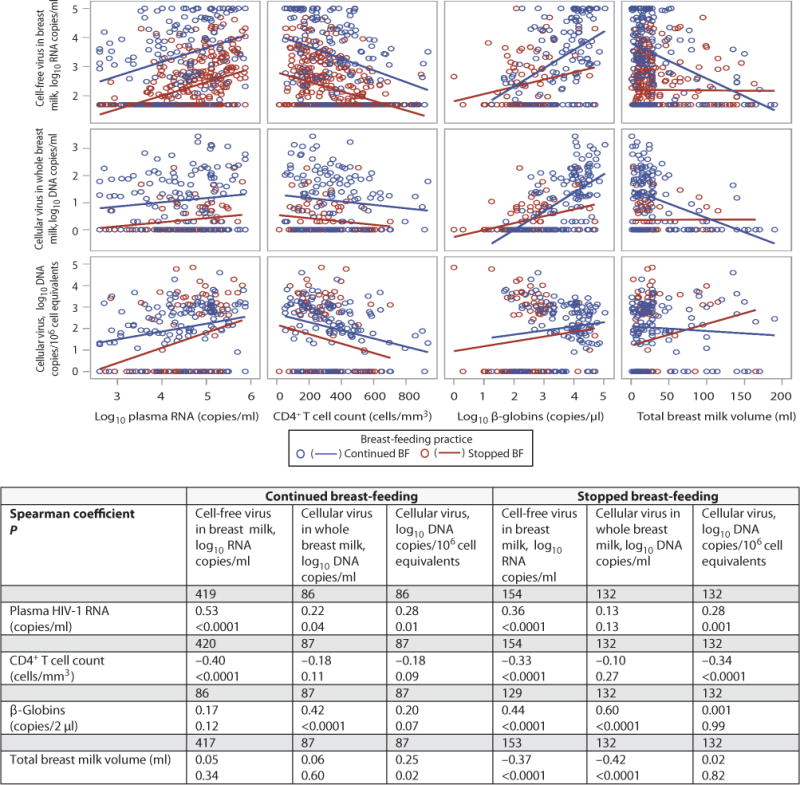
Fig. 5.

Scatter plots showing associations between breast milk HIV-1 RNA concentrations in copies/ml, HIV-1 DNA concentration in copies/ml and HIV-1 DNA concentration in copies per 106 cell equivalents and plasma HIV-1 RNA, CD4 T cell count, milk beta-globin concentration, and total breast milk volume produced after timed pumping, stratified by feeding practice at 4.5 months. In the table are shown the spearman correlation coefficients and associated p-values for each bivariate association in the continued breastfeeding and stopped breastfeeding groups separately as well as the number of samples analyzed for each association. Associations between breast milk HIV-1 RNA, beta-globin and milk volume were significantly modified by feeding practice (p-value for interactions=0.02 and <0.0001, respectively); as were associations with breast milk HIV-1 DNA copies/ml (p-value for interactions=0.0003 and 0.0008, respectively); association between breast milk HIV-1 DNA copies/106 cell equivalents and milk volume was significantly modified by feeding practice (p-value for interaction=0.03). P-values for the interactions were calculated using linear regression with multiplicative interaction terms of the relevant covariates.
