
Figure 1. Comparison of coefficients of variables predicting log cystatin and log creatinine.
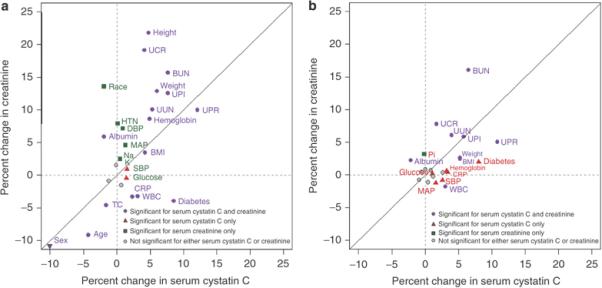
Solid diagonal line is the line of identity. For continuous predictor variables the coefficients are expressed as the percent differences in cystatin or creatinine associated with a difference of one interquartile range in the predictor variable (i.e., a change from the 25th to 75th percentile) after adjusting for GFR in models that incorporate measurement error in the GFR assay. For dichotomous predictor variables the coefficients indicate the percent differences in cystatin or creatinine associated with the presence vs. the absence of the factor. Variables that fall along the line of identity have a similar relationship to serum creatinine and cystatin C. Points away from the line of identity represent variables with a different magnitude of association with cystatin C and creatinine. Variables near the origin have a weak relationship with the filtration marker.
The plot character colors indicate significance of the relationships between the predictor variable to cystatin C, creatinine, neither or both. Grey dots indicate variables that were not significantly associated with either cystatin C or creatinine. For all variables, the coefficients for cystatin C and creatinine were significantly different from one other (P<0.001).
HTN, hypertension; BMI, body mass index; SBP, systolic blood pressure; DBP, diastolic blood pressure; MAP, mean arterial blood pressure; WBC, white blood cell count; Na, sodium; K, potassium; Pi, phosphate; Ca, calcium; HCO3, bicarbonate; TC, total cholesterol; alb, albumin; gluc, glucose; UUN, urine urea nitrogen; UCR, urine creatinine; UPI, urine phosphate; UPR, urine protein
Panel a: After adjustment for GFR and GFR measurement error
Variables that were not significantly associated with either variable (indicated by gray dots) include serum bicarbonate, total calcium and phosphate. Sex is indicated on the margins of the figure as a downward arrow, as the coefficients are bigger than the scale.
Panel b: After adjustment for GFR and GFR measurement error, age, sex and race
Variables that were not significantly associated with either cystatin C or creatinine (indicated by gray dots) include hypertension, height, diastolic blood pressure, sodium, bicarbonate, total calcium, and total cholesterol.