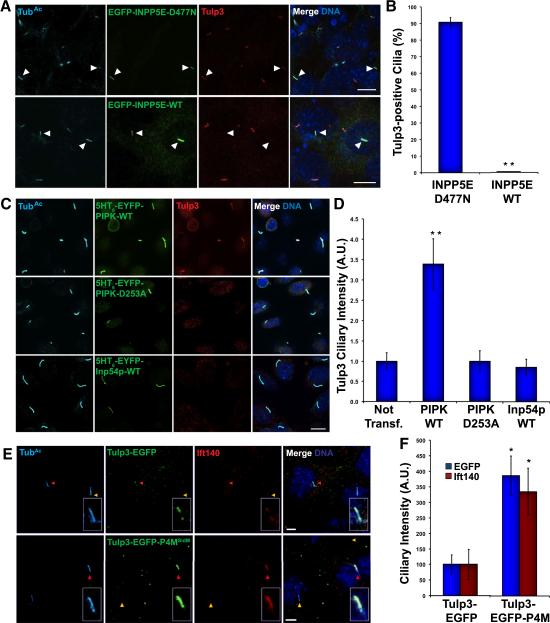
Fig. 5. PI(4,5)P2 recruits Tulp3 and IFT-A to cilia.
(A) Inpp5e−/− MEFs expressing EGFP-INPP5E-D477N or EGFP-INPP5E-WT were stained for TubAc (cyan), EGFP (green) and Tulp3 (red). Nuclei were stained with DAPI in all panels. (B) Quantitation of the percentage of EGFP-INPP5E-D477N- or EGFP-INPP5E-WT-expressing Inpp5e−/− MEF cilia positive for Tulp3. (C) IMCD3 cells expressing 5-HT6-EYFP-PIPK, 5-HT6-EYFP-PIPK(D253A) or 5-HT6-EYFP-Inp54p were stained for TubAc (cyan), EYFP (green) and Tulp3 (red). (D) Quantification of the fluorescence intensity of Tulp3 in cilia of untransfected cells, and those expressing 5-HT6-EYFP-PIPK, 5-HT6-EYFP-PIPK(D253A) or 5-HT6-EYFP-Inp54p. (E) Inpp5e+/− MEFs transfected with expression plasmids for Tulp3-EGFP or Tulp3-EGFP-P4MSidM were stained for TubAc (cyan), EGFP (green), and Ift140 (red). Cilia of transfected and untransfected cells are indicated by red and yellow arrowheads, respectively. (F) Quantification of the fluorescence intensity of the EGFP of Tulp3-EGFP or Tulp3-EGFP-P4MSidM in cilia of transfected Inpp5e+/− MEFs, and of Ift140 in these same cilia. Data are means±SEM. One asterisk indicates p<0.05 and two p<0.01 in unpaired t-tests.

