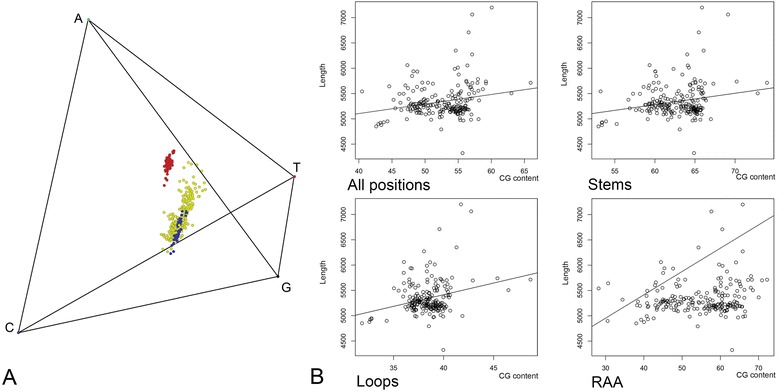
Fig. 1.

Nucleotide composition. a- Tetrahedric graph showing nucleotide composition of loop (red), stem (blue), and regions of ambiguous alignment (RAAs, yellow) of rDNA. b- Nucleotide composition (CG content) plotted against the sequence length for the entire rDNA alignment and the three partitions; regression line is given for each graph
