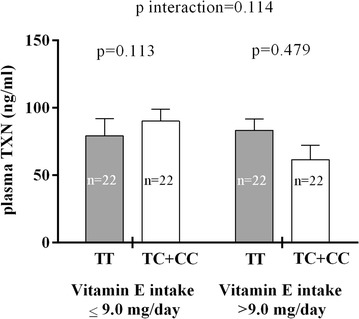
Fig. 4.

Analysis of the interaction between rs2301241 and vitamin E intake on plasma TXN levels. Data shown are the mean (±SEM). p (p value) was assessed by ANOVA and adjusted by age, gender, education level (<high school), hypertension, glucose, high-density lipoprotein cholesterol, triglycerides, 8-oxodeoxyguanosine, and alcohol consumption
