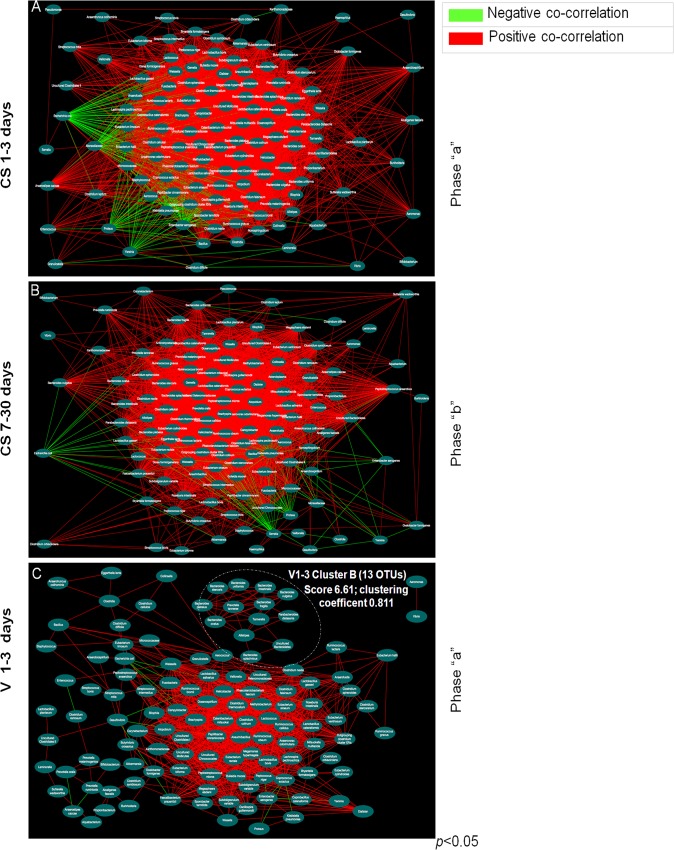
Fig 4. Graphical representation of OTUs co-occurrence networks.
Panel A shows the OTUs co-occurrence network for CS-delivered babies at 1–3 days following birth (see sheet B in S5 Table for details). Panel B shows OTUs co-occurrence network for CS-delivered babies at 7–30 days following birth (see sheet C in S5 Table for details). Panel C shows OTUs co-occurrence network for V-delivered babies at 1–3 days following birth (see sheet D in S5 Table for details). Red line indicates a positive correlation and a green line indicates a negative correlation. Pearson’s test was used to evaluate the correlation amongst OTUs (statistical significance was assessed with p<0.01).

