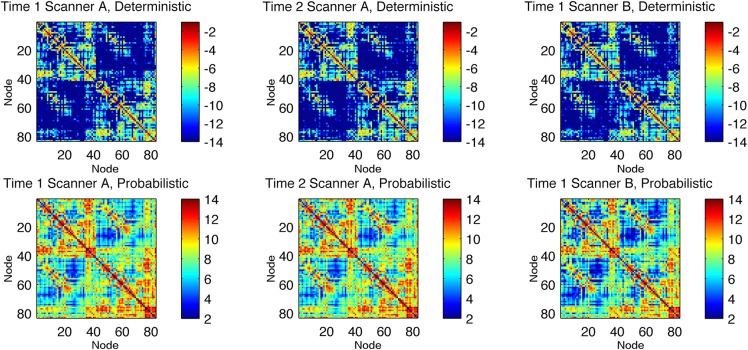
Fig 1. Average connectivity matrices from all subjects for each scanning session (Time 1 and 2 in Scanner A represent measures from the same MRI scanner in different time points, and Time 1 in Scanner B represents a third measure from a different MRI scanner).
Each matrix element represents the weighted connectivity between the ROIs indicated by the column and by the row. The color bars indicate log(weighted connectivity).

