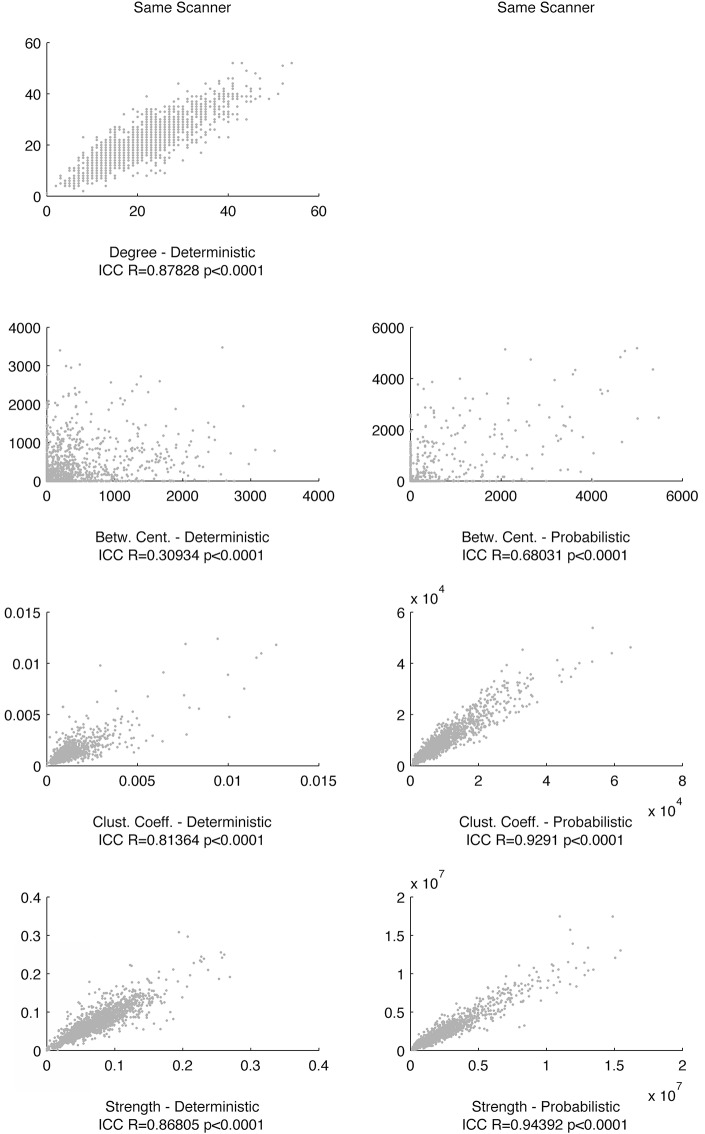
Fig 5. The scatter plots demonstrate the relationship between link-wise graph theory metrics obtained from connectomes calculated from scanning session in time 1 (x-axis) and in time 2 (y-axis) within the same MRI scanner.
The scale set for the x-axis is the same as for the y-axis for all graphs. The ICC between each pair of measurements is displayed below each scatter plot. Of note, the relationship between degrees was not assessed for probabilistic tractography given the low sparsity of networks generated from probabilistic methods, therefore leading to a ceiling degree effect.

