Fig. 2.

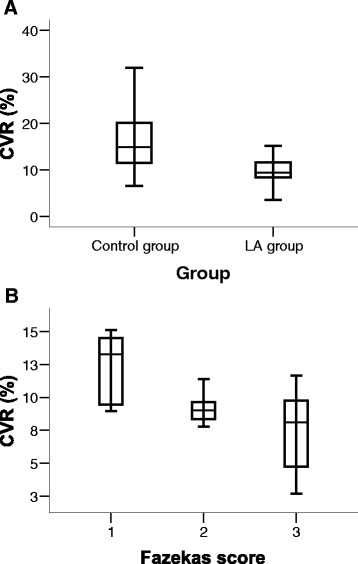
Cerebrovascular reactivity to L-arginine (CVR) distribution in control group and leukoaraiosis (LA) group (a) and in the subgroups of LA (b). SD indicates standard deviation

Cerebrovascular reactivity to L-arginine (CVR) distribution in control group and leukoaraiosis (LA) group (a) and in the subgroups of LA (b). SD indicates standard deviation