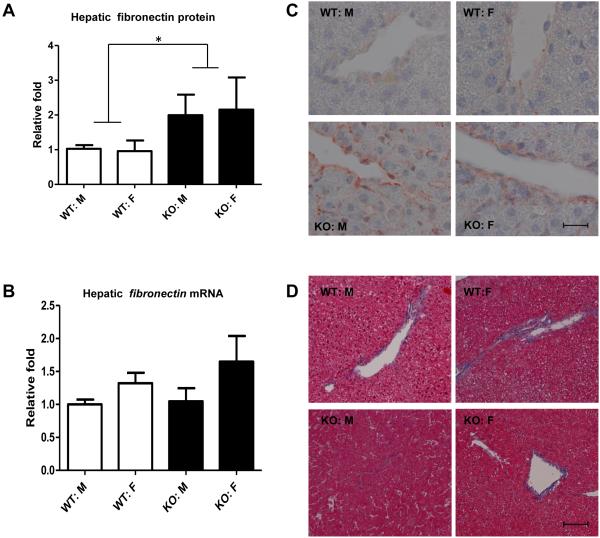
Figure 2.
Effect of BGN deficiency on hepatic fibronectin expression and liver histology. A: Western blots of fibronectin were analyzed by densitometry (corrected for actin). Shown is mean±SEM from N = 5-12/group. B: real-time PCR analysis was performed to determine the mRNA levels of hepatic fibronectin. C: representative light micrographs of fibronectin immunohistochemistry staining in liver sections from 4 groups of mice. Scale bar: 20 μm. Original magnification X1000. D: Hepatic histology was evaluated with Masson’s Trichrome stain. Shown are representative sections (from N=5-12/ group) from WT or KO mice. Scale bar: 200 μm. Original magnification: X200.

